Retirement Options
Razor Academy
Introduce new RazorPlan users to the Retirement Options screen that can be used to answer clients’ questions about retirement.
Peter and Stacy Matthews
Peter and Stacy, 54 and 52 respectively, are thinking more about their retirement years and are looking to make sure they are on track to funding their retirement years. They feel like they are in pretty good shape but have never seen an analysis of their situation and have a few questions about their potential retirement. They would like to know if they can keep spending what they are spending today in their retirement years. They are also interested in knowing if they could potentially increase their retirement income or maybe retire prior to age 65.
Disclaimer: The results and recommendations outlined in this example are for illustrative purposes only. The recommendations made are designed to demonstrate functions within RazorPlan and are not intended to act as a guide or real client recommendation.
Note: Due to potential changes in the software or updates to math and taxation, your results may not exactly match the following outline.
To accomplish the client’s objective of understanding if they are on track to fund their retirement, RazorPlan can take their current information and produce the Retirement Options report.
Their current financial situation is the following:
After entering all of Peter and Stacy’s information into RazorPlan we can go to the Charts area of the program to see if they are on track. The Retirement Option chart (see below) generates 4 possible options by looking at 4 areas of the plan and changing 1 of those areas while keeping the other 3 the same. The 4 areas included on the Retirement Options are Lifestyle Needs, Retirement Age, Rate of Return and Planned Retirement Savings.
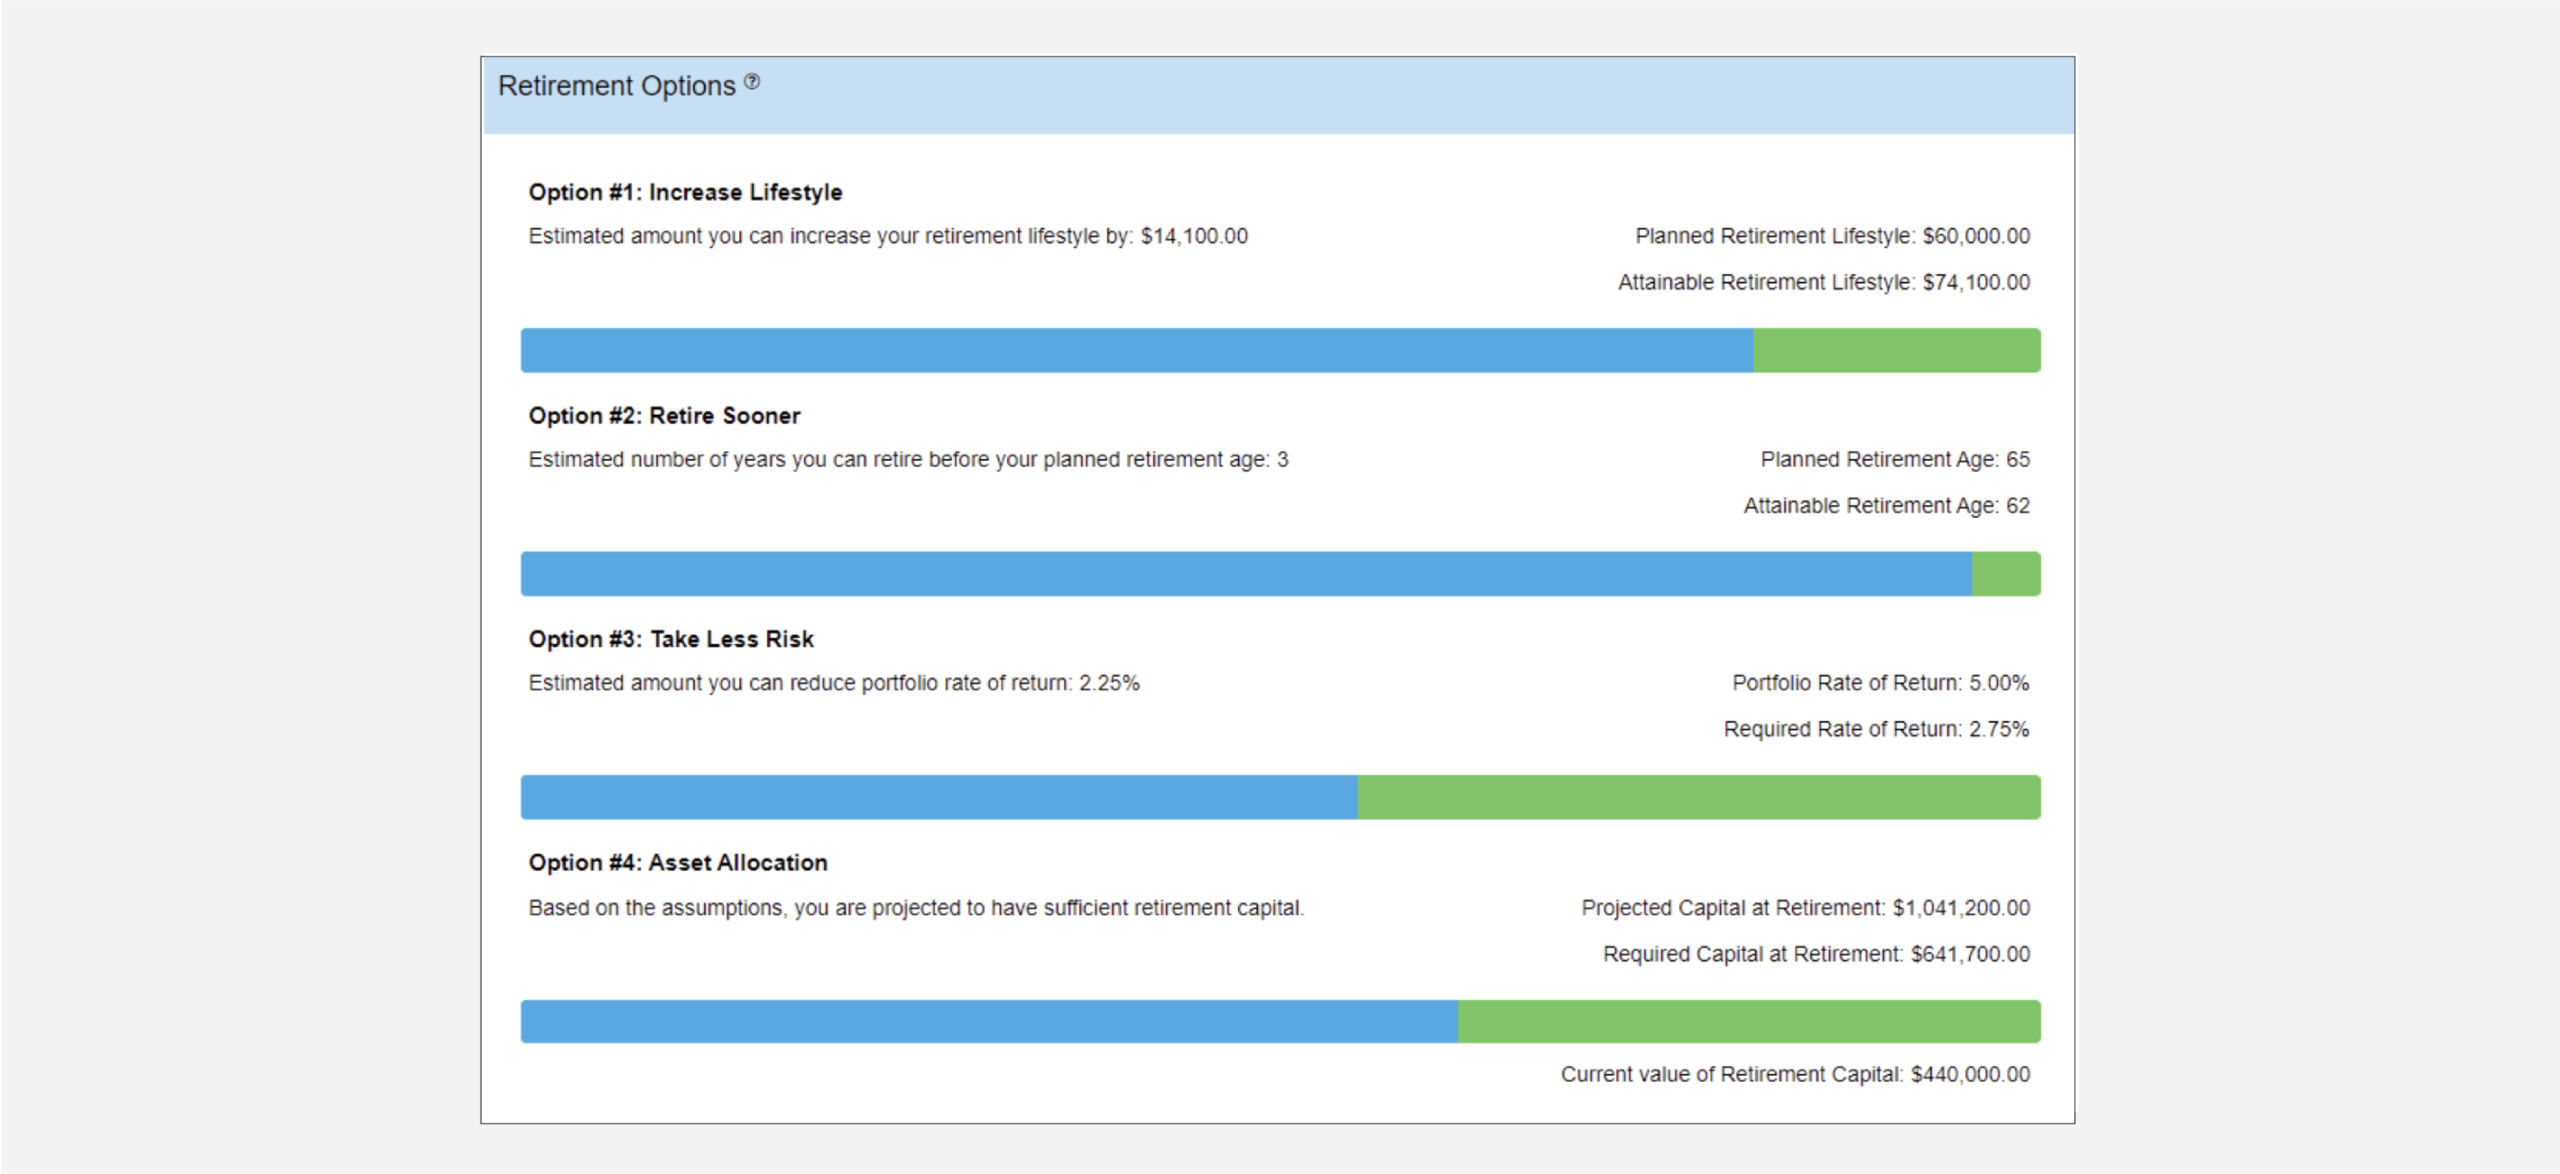
Option 1 looks at changing the couple’s retirement lifestyle needs while keeping their planned retirement age, rate of return and retirement savings the same as what is entered into the RazorPlan data entry screens.
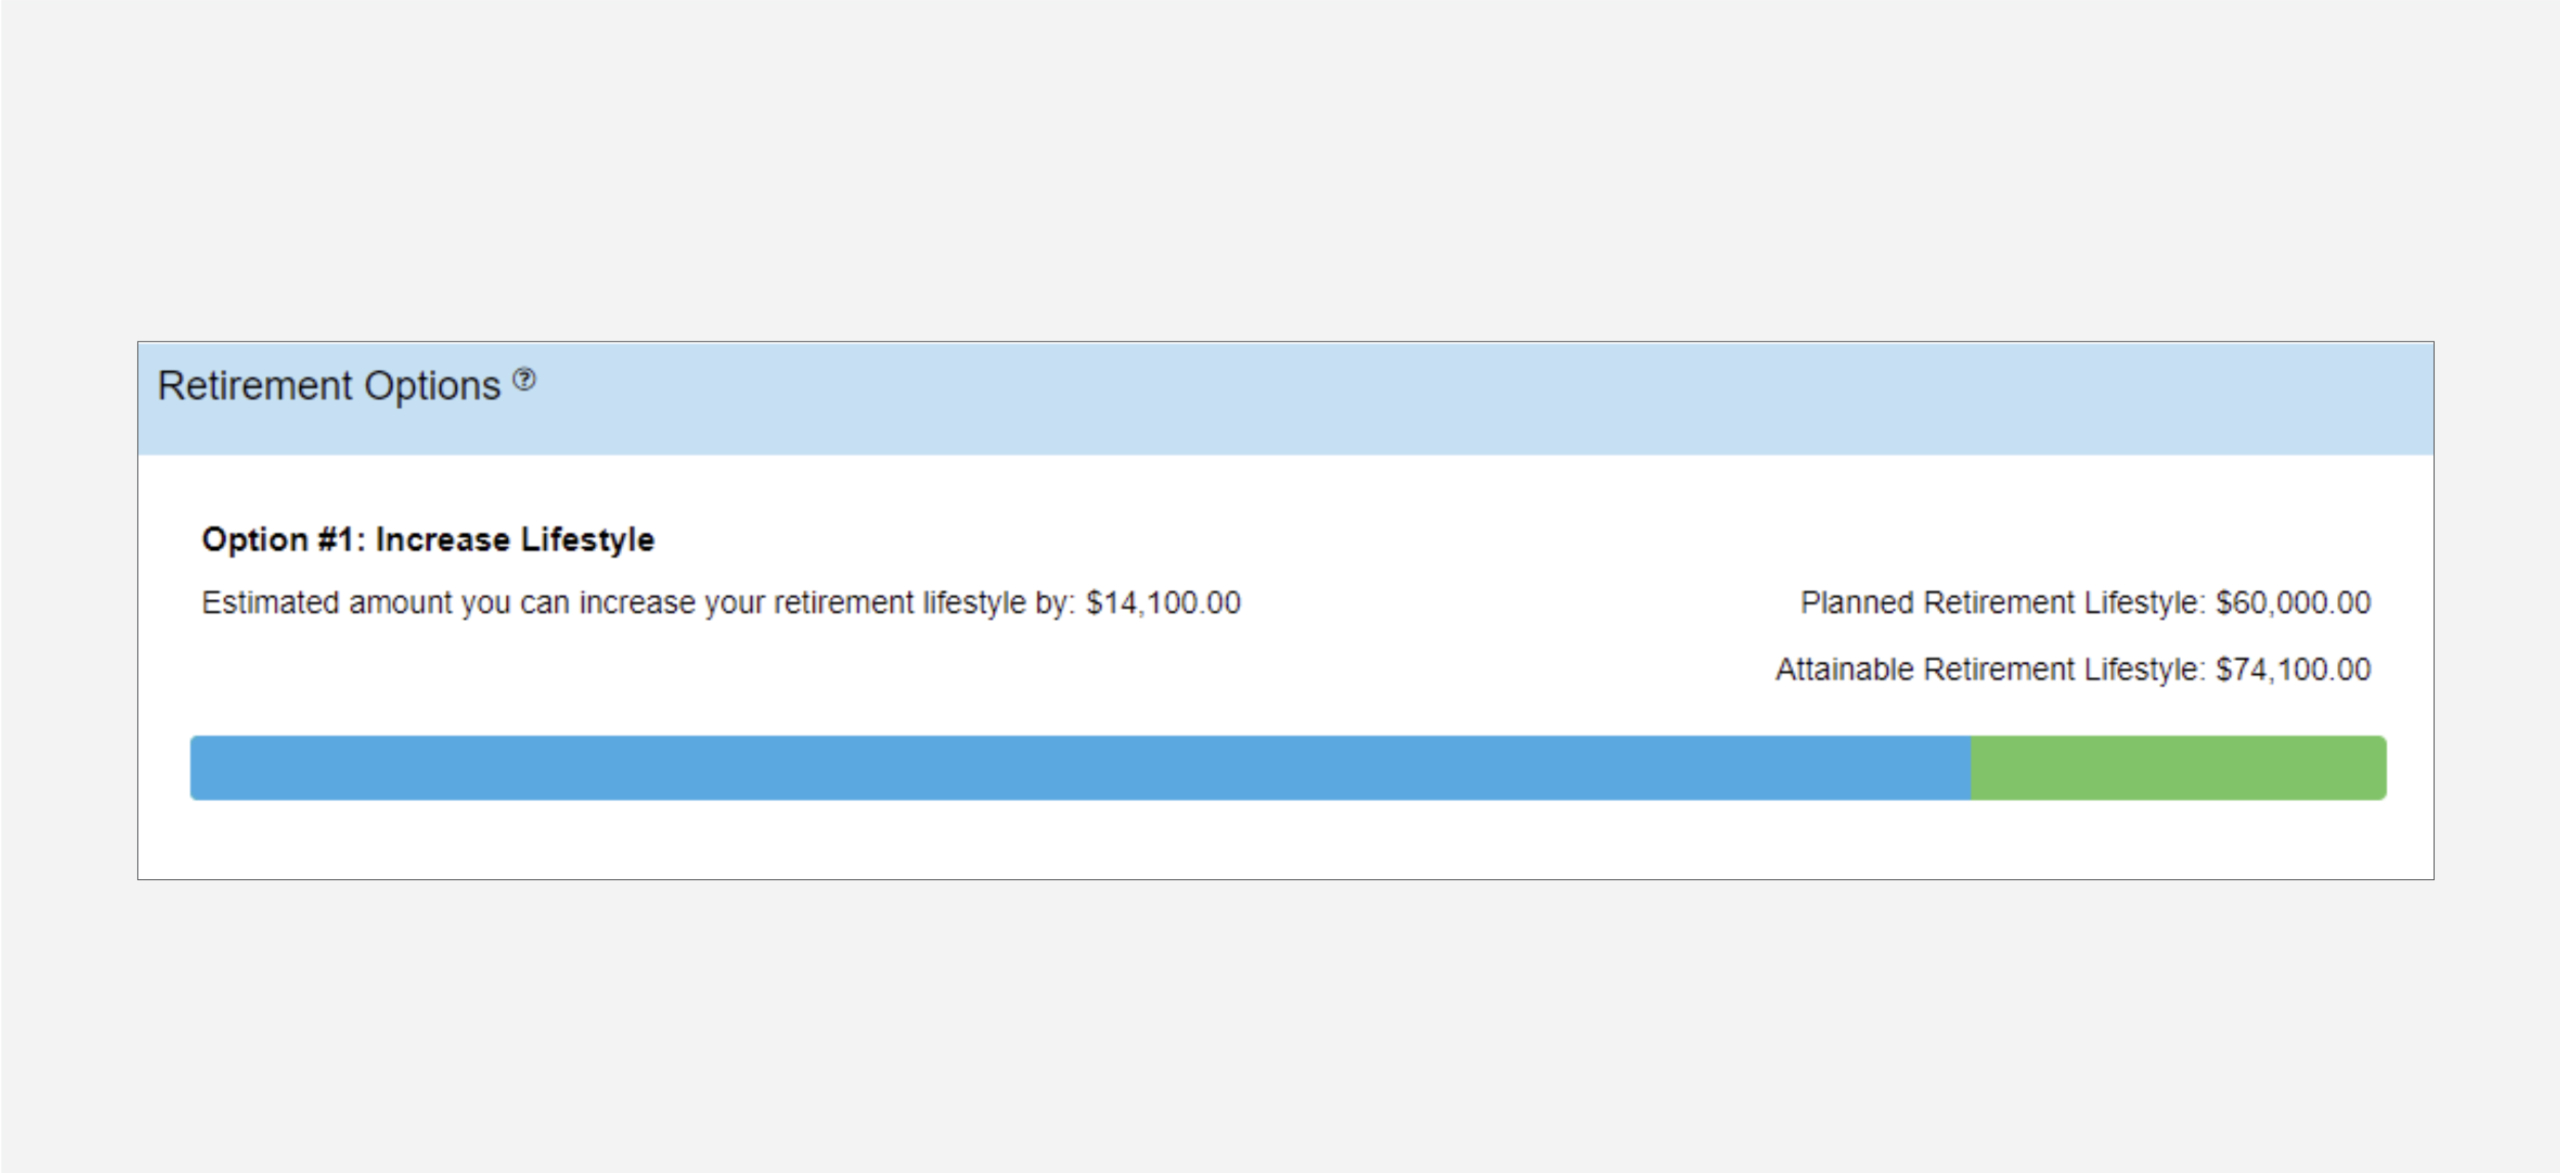
For Peter and Stacy their planned retirement lifestyle is $5,000 per month or $60,000 a year. Option 1 shows that Peter and Stacy could increase their lifestyle to $74,100 which is a $14,500 increase in their annual lifestyle. This increase in their lifestyle is attainable based on them retiring at their planned retirement ages of 65, maintaining their portfolio rate of return at 5% and that they keep making their planned savings so that they will have the projected capital of $1,041,200 at retirement which is displayed under option 4.
Option 2 focuses on the planned retirement age and displays the attainable retirement age of the clients while keeping their planned retirement lifestyle, rate of return and planned retirement savings the same as entered into the data entry area.
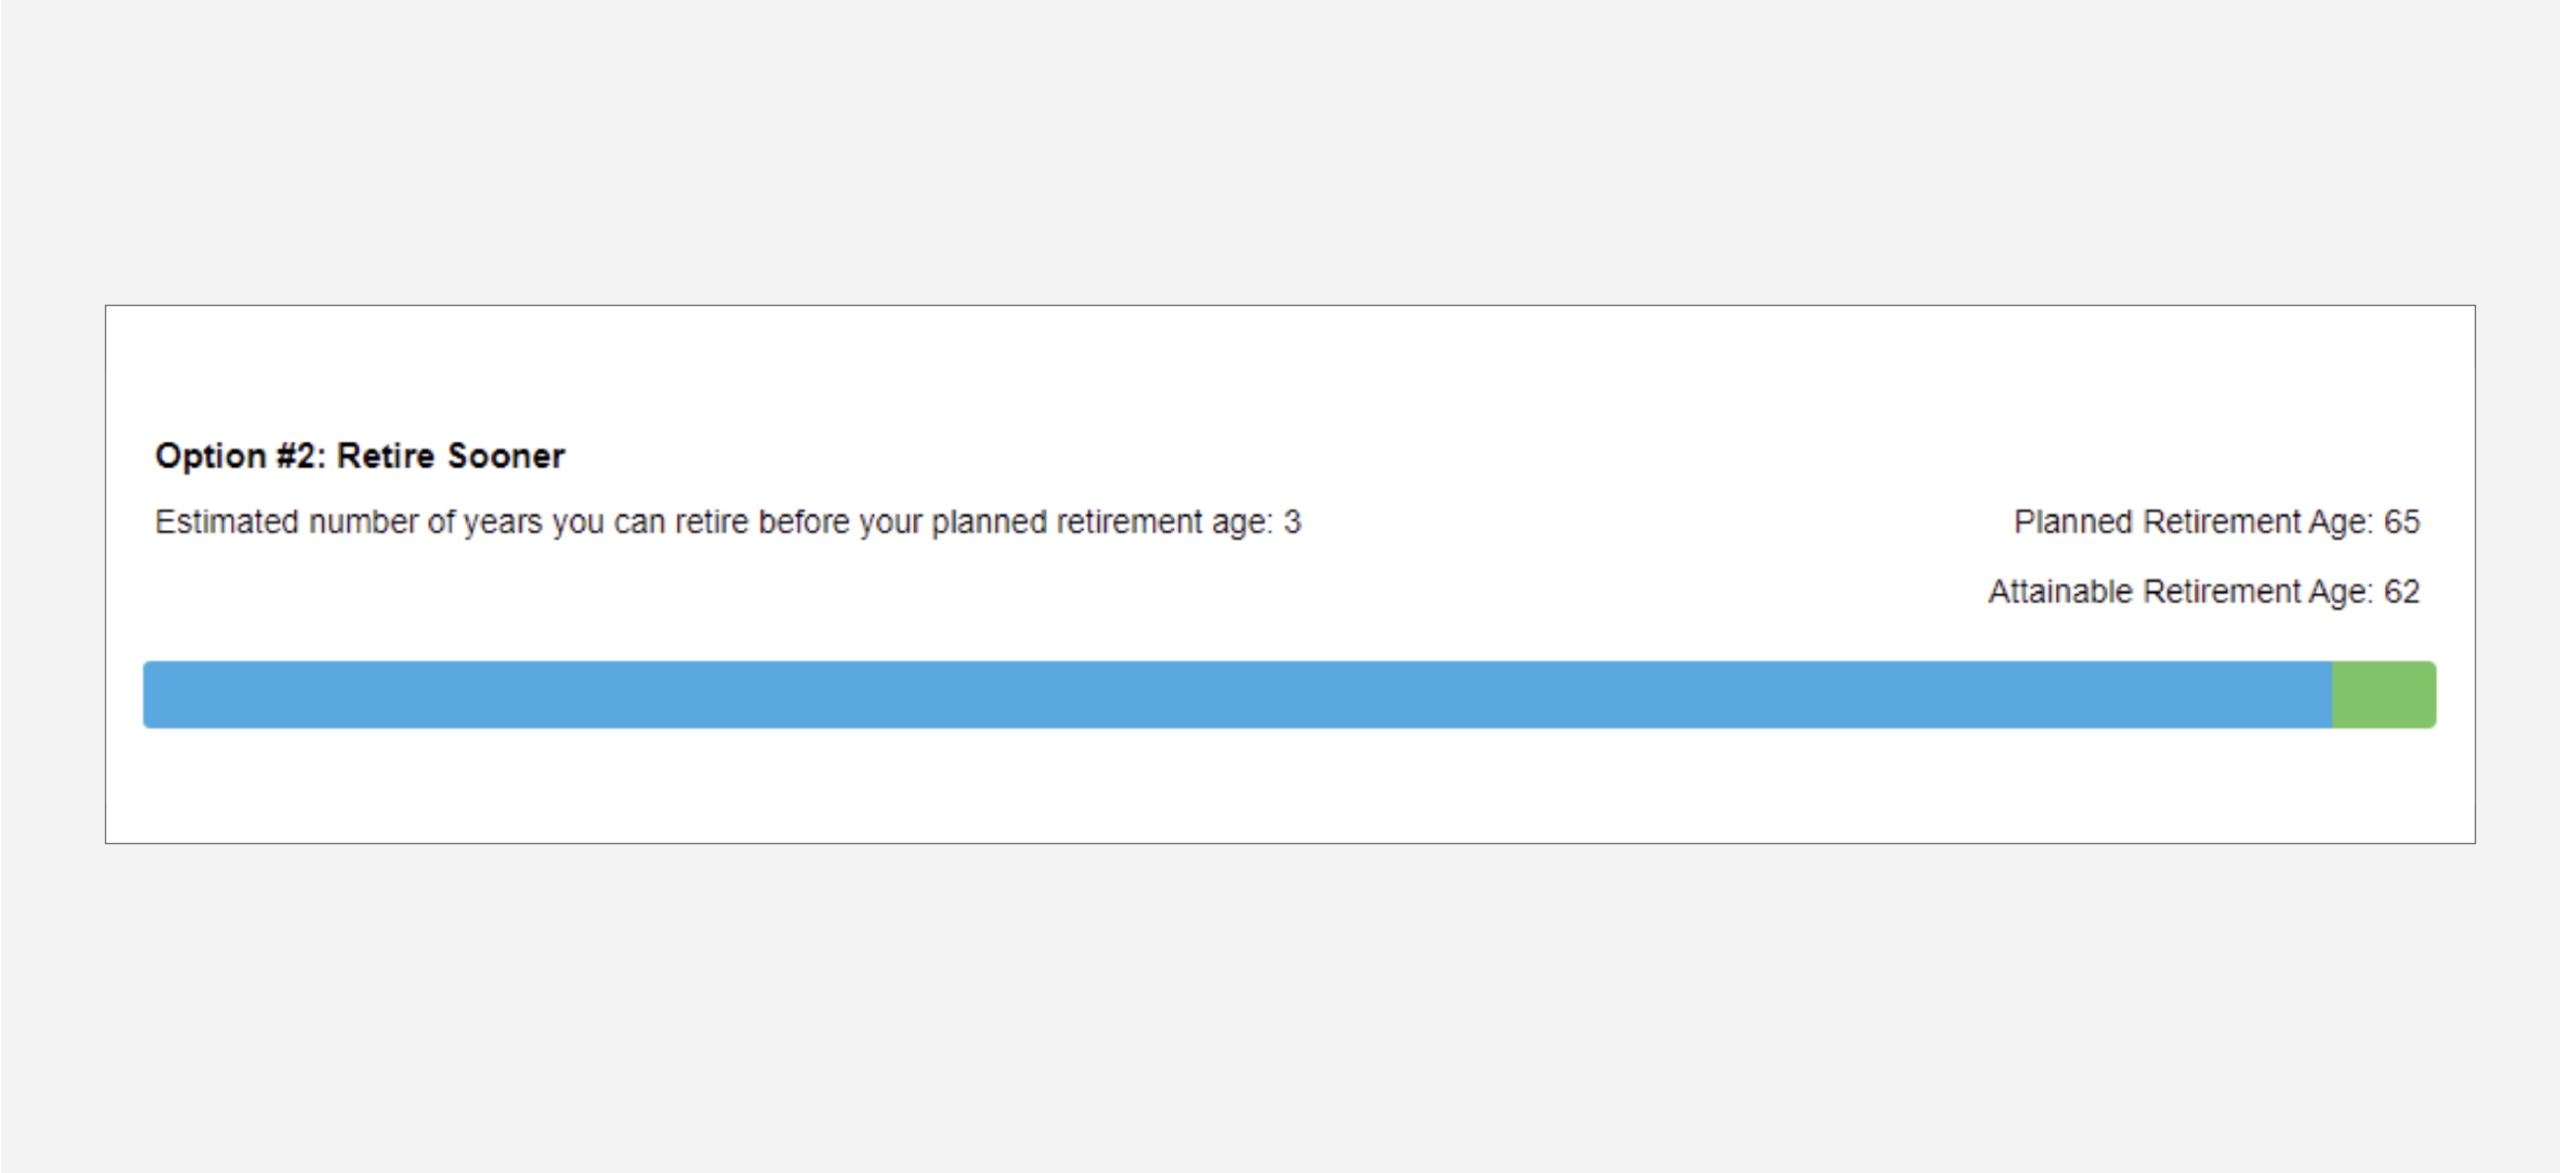
The Retirement Options screen shows that Peter and Stacy have an attainable retirement age of 62 which is 3 year earlier than their planned retirement age of 65. This attainable retirement age is possible as long as Peter and Stacy keep their current savings rate and not change their planned retirement lifestyle from the $60,000 per year.
Option 3 helps identify the average rate of return needed to fund their retirement lifestyle over their lifetime. This minimum rate is compared to the expected rate of return entered in data entry and helps clients determine if they need to adjust their portfolios.
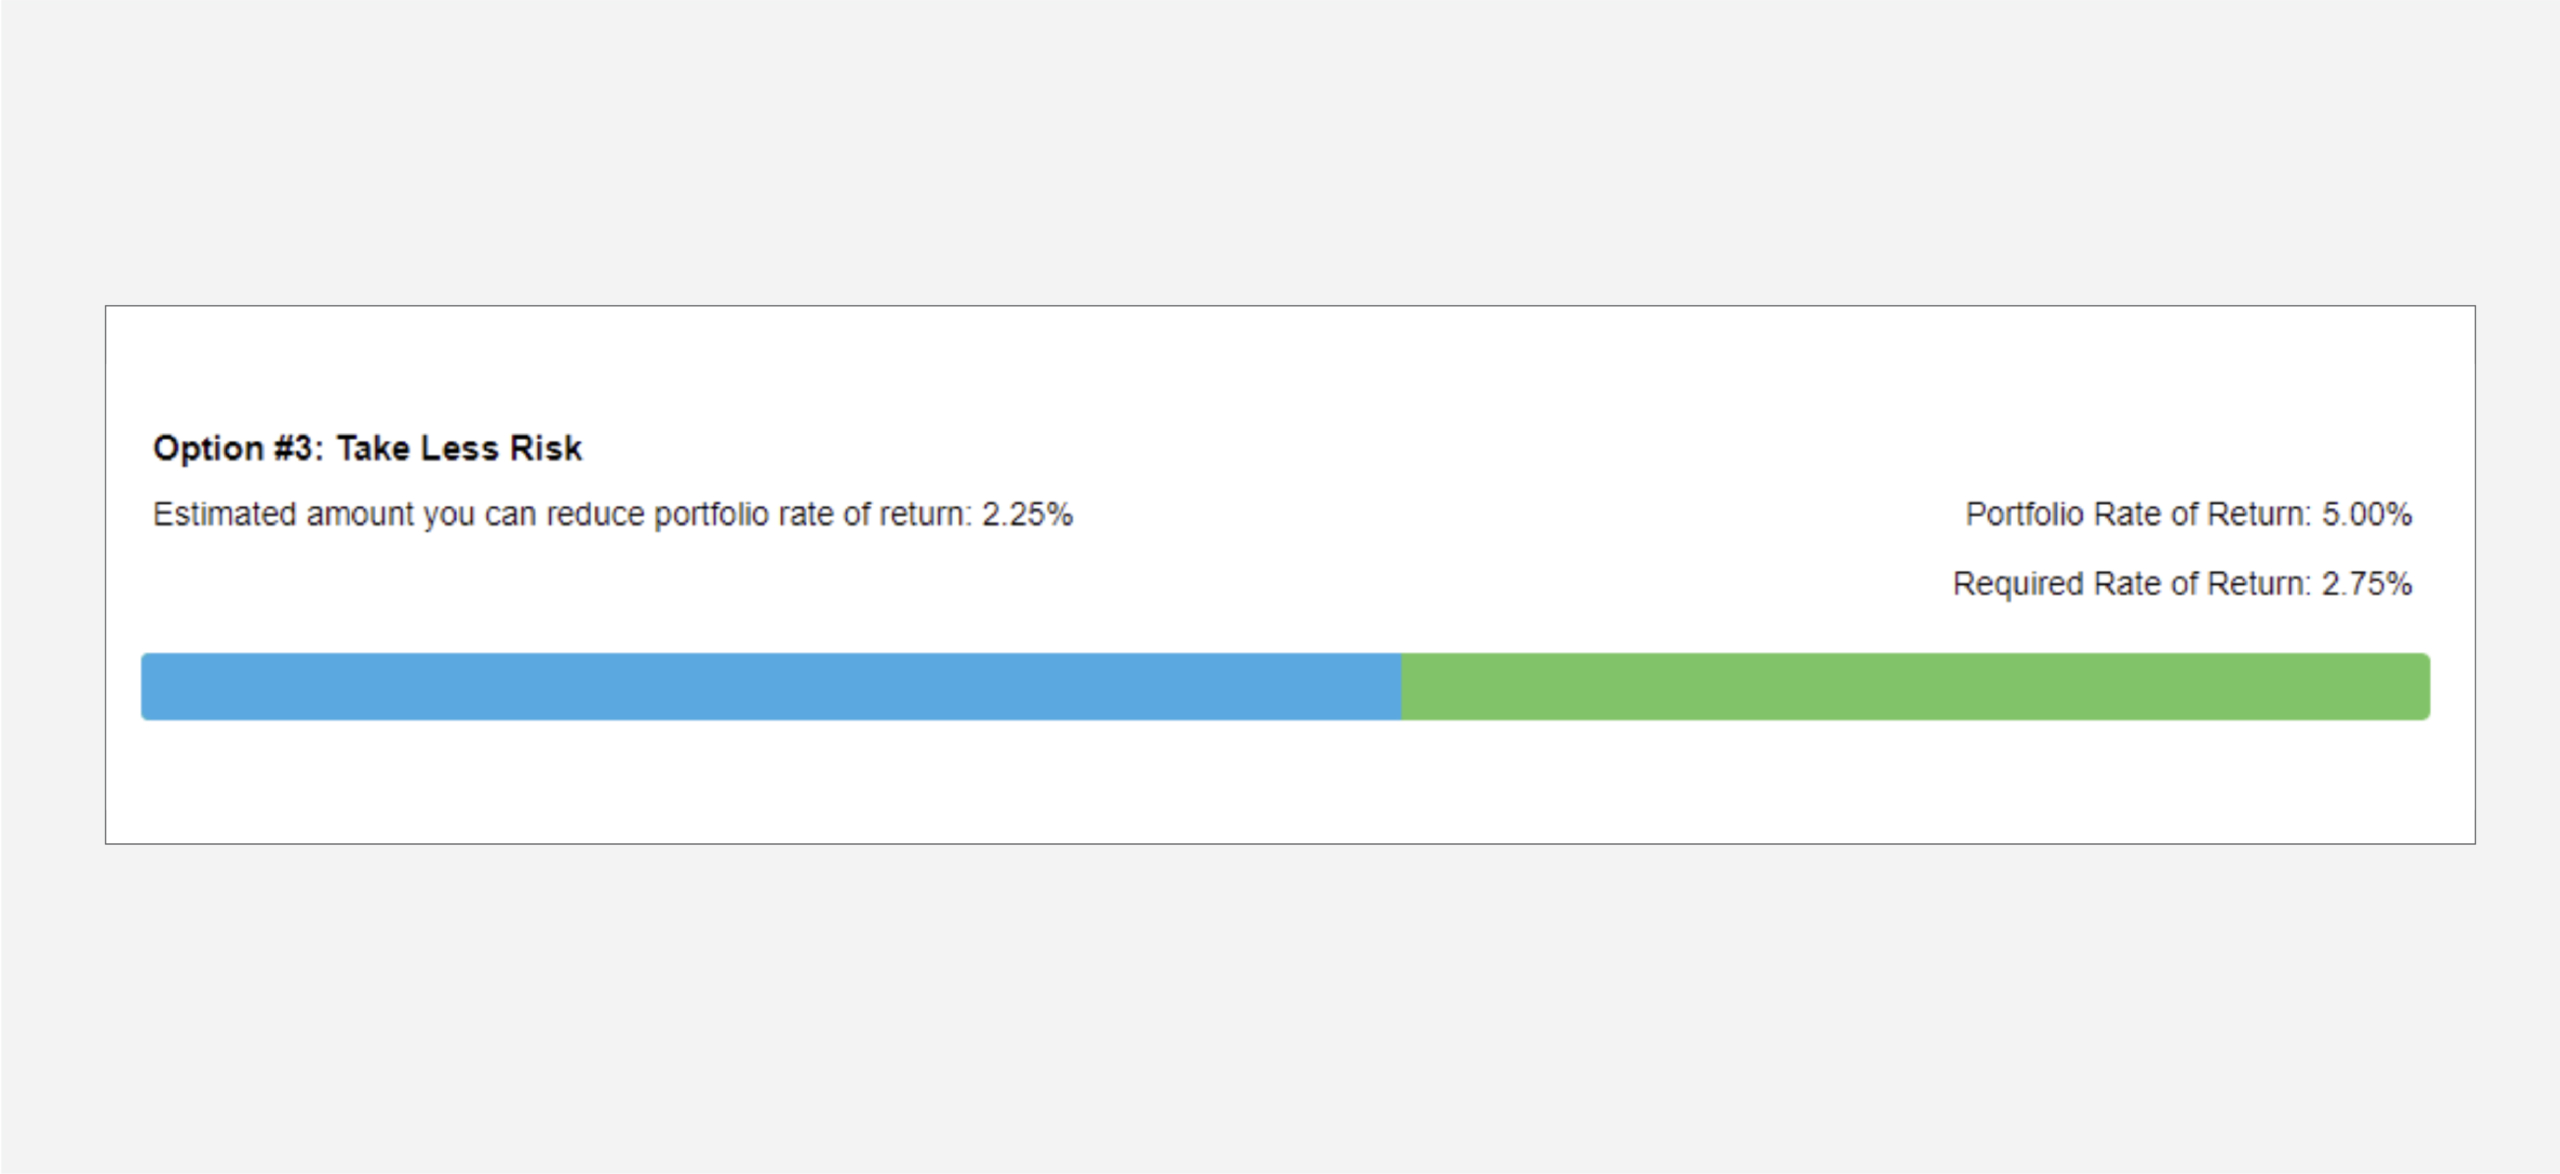
For Peter and Stacy, option 3 shows that compared to their assumed rate of return of 5% they could achieve their planned retirement income of $60,000 from age 65 until life expectancy with a portfolio that produces an average return of 2.75%. This reduction of 2.25% in their assumed return indicates that their plan is very healthy because the assumptions can essentially be wrong by more than 2% every year and they will still achieve their retirement goals.
Option 4 displays the projected capital the clients will have at their planned retirement age. This amount is compared to the required capital needed to fund their planned retirement lifestyle. This option will display if the clients have sufficient capital to fund their retirement and identify if they need to liquidate fixed assets or save more when they do not have enough retirement capital.
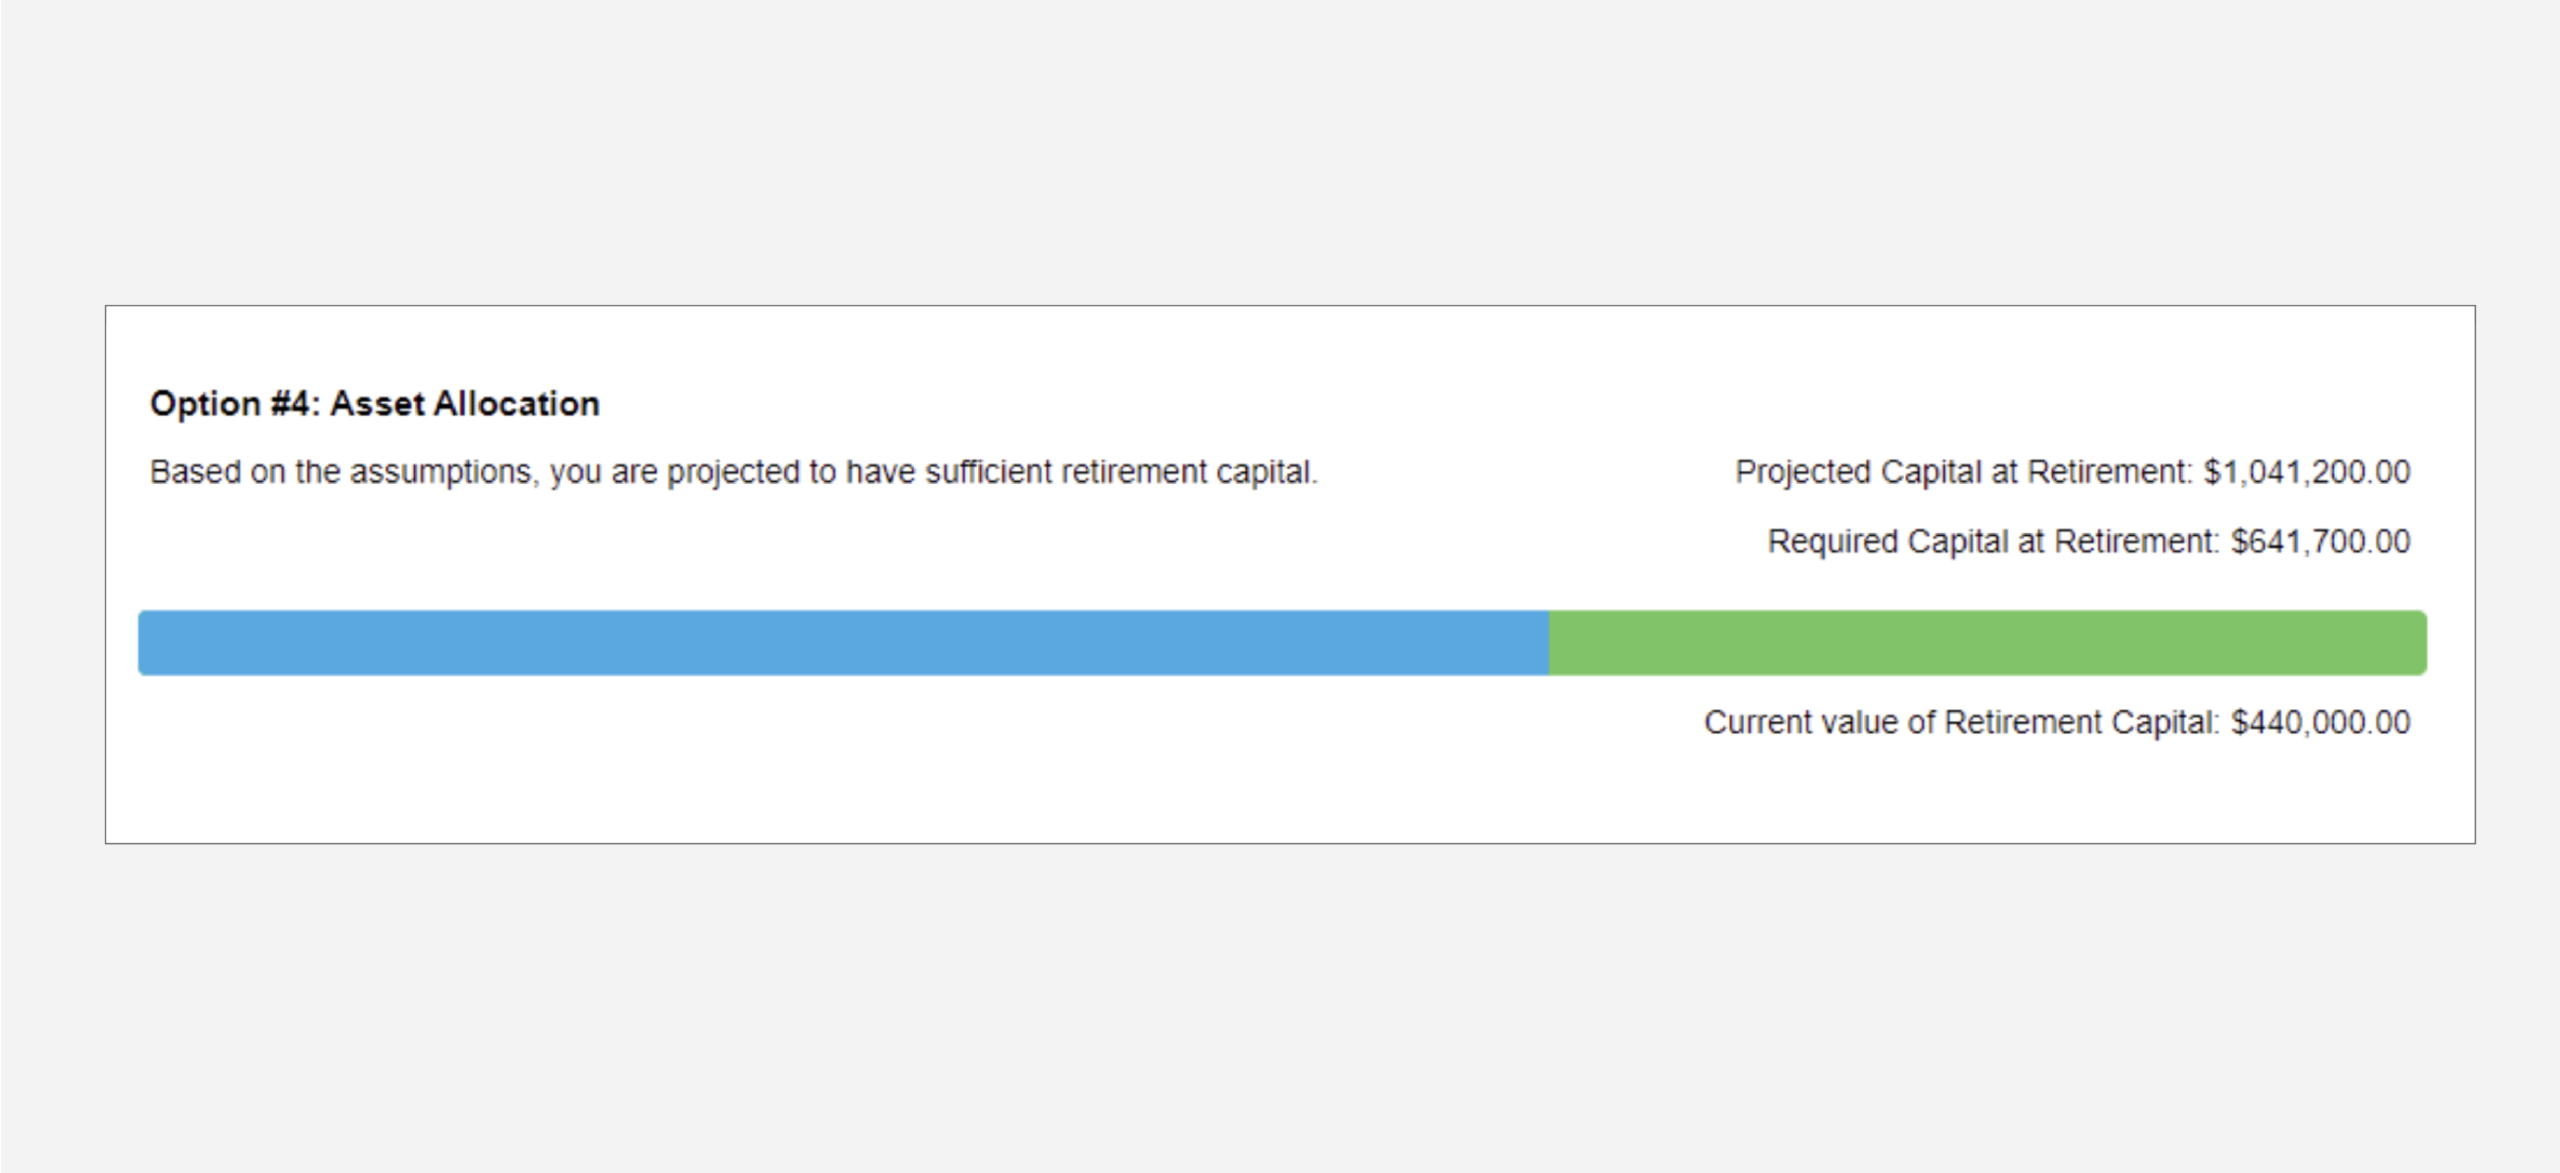
For the Matthews’ situation, they are projected to have $1,041,200 of assets at their planned retirement age of 65. Option 4 compares their projected assets to the estimated $641,700 required to fund their retirement lifestyle of $60,000 per year indicating that Stacy and Peter will have approximately $400,000 of excess retirement assets.
All four of the options show the Matthews that they are on track to funding their planned retirement at their planned retirement age. These options also provide alternatives to the Matthews’ current plans for their consideration. Knowing this information is the first step to have meaningful conversations with Peter and Stacy about their future retirement plans.
Peter and Stacy have asked you to determine if it is possible to increase their retirement spending for the first 10 years of their retirement so they can travel more. In this situation, Stacy would also change her retirement age to 63 so that they both retire at the same time. They have asked to see how their retirement options change if they needed an additional $2,000 per month (after-tax), increasing their retirement lifestyle to $84,000 per year from ages 65 to 75.
After adjusting their lifestyle to $7,000 per month and Stacy’s retirement age to 63, the retirement options screen adjusts to show that the Matthews would need to make adjustments to their plans today to accomplish these retirement plans.
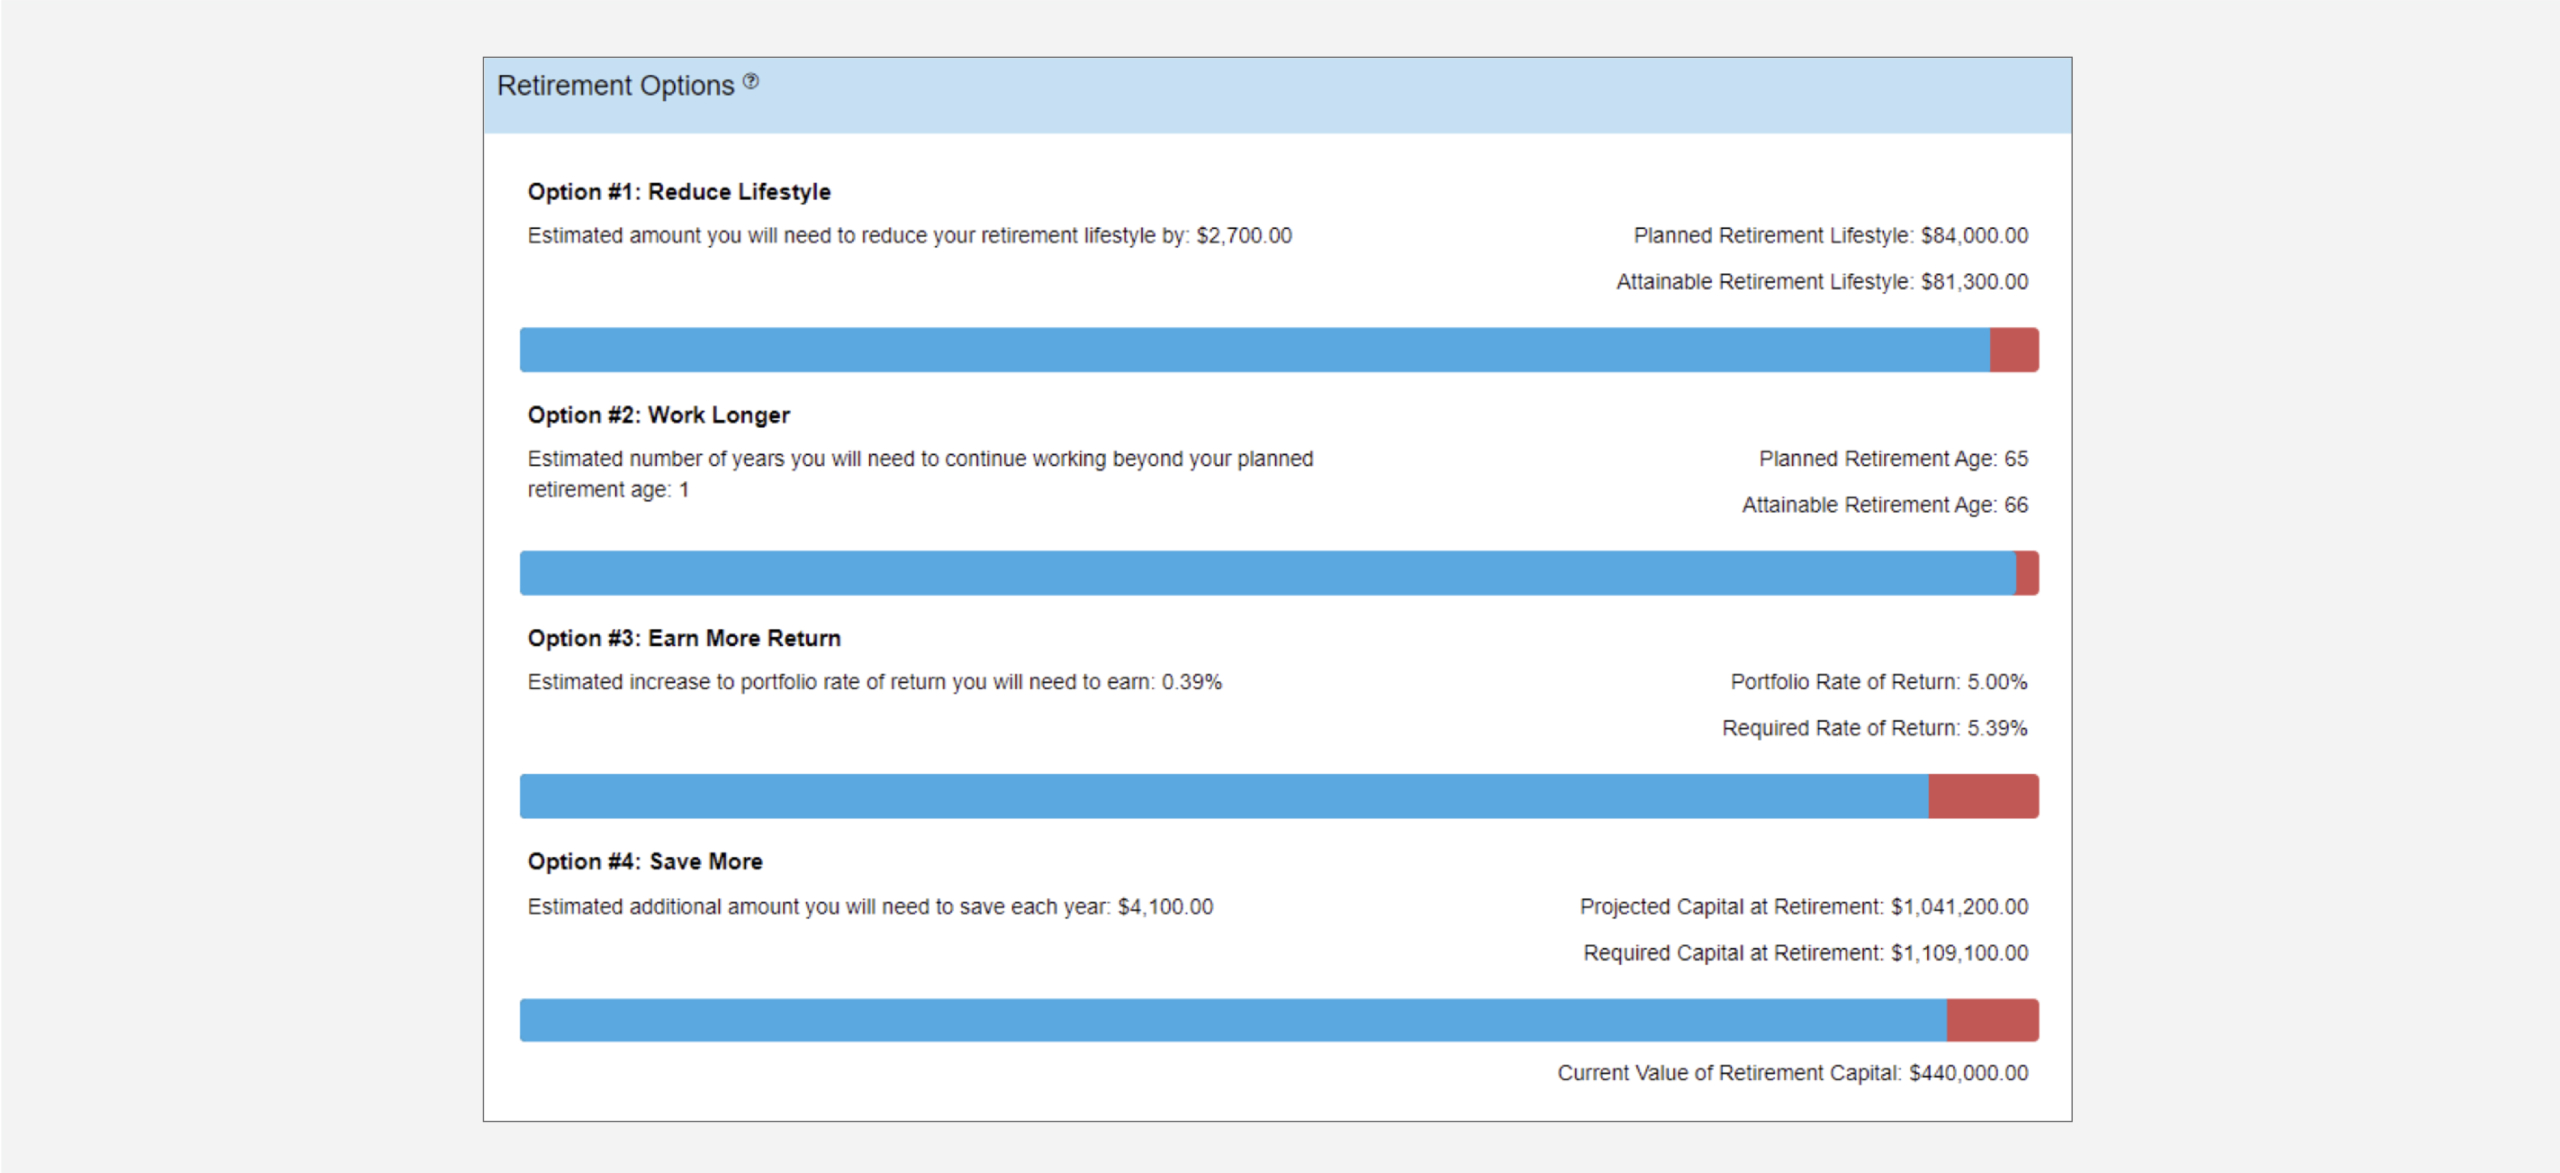
When their lifestyle spending is increased between the ages of 65 and 75 the retirement options screen shows that their ability to meet this new lifestyle is not possible without making changes to their planned retirement ages, rates of return or planned savings. Option 4 on the retirement options screen shows that if Stacy and Peter want to retire in the same year and spend more on travel in the first 10 years of their retirement they would need to save an additional $4,100 per year to achieve this goal.
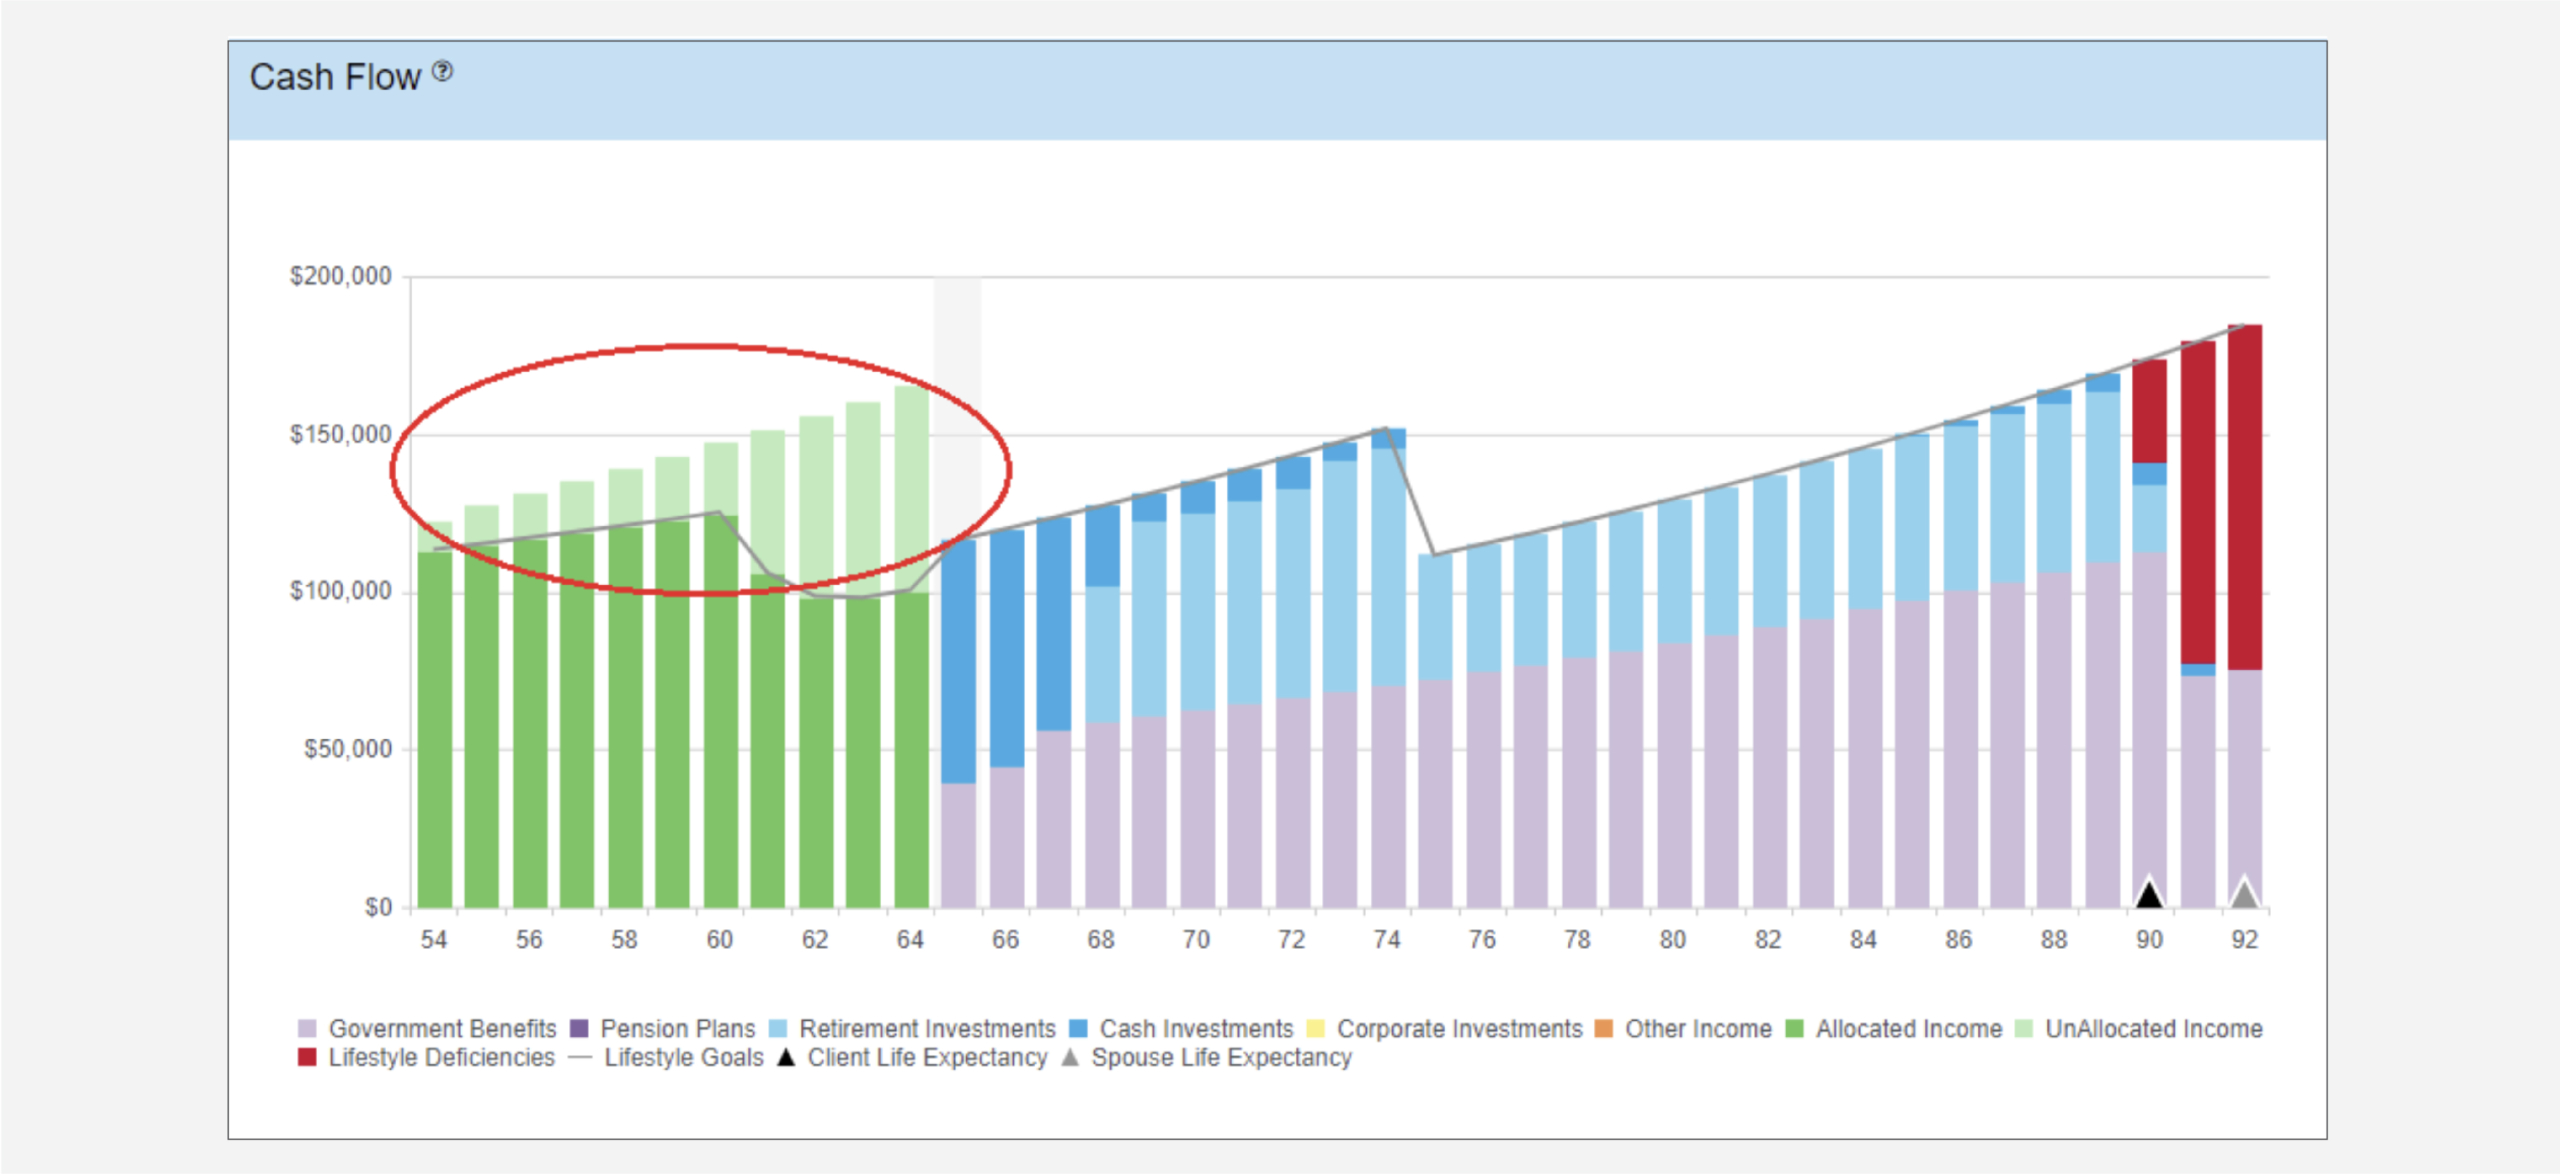
Reviewing Peter and Stacy’s cash flow chart reveals that they have excess cash flow in their pre-retirement years so if they make these additional contributions to their retirement savings then they can increase their retirement lifestyle for those 10 years.
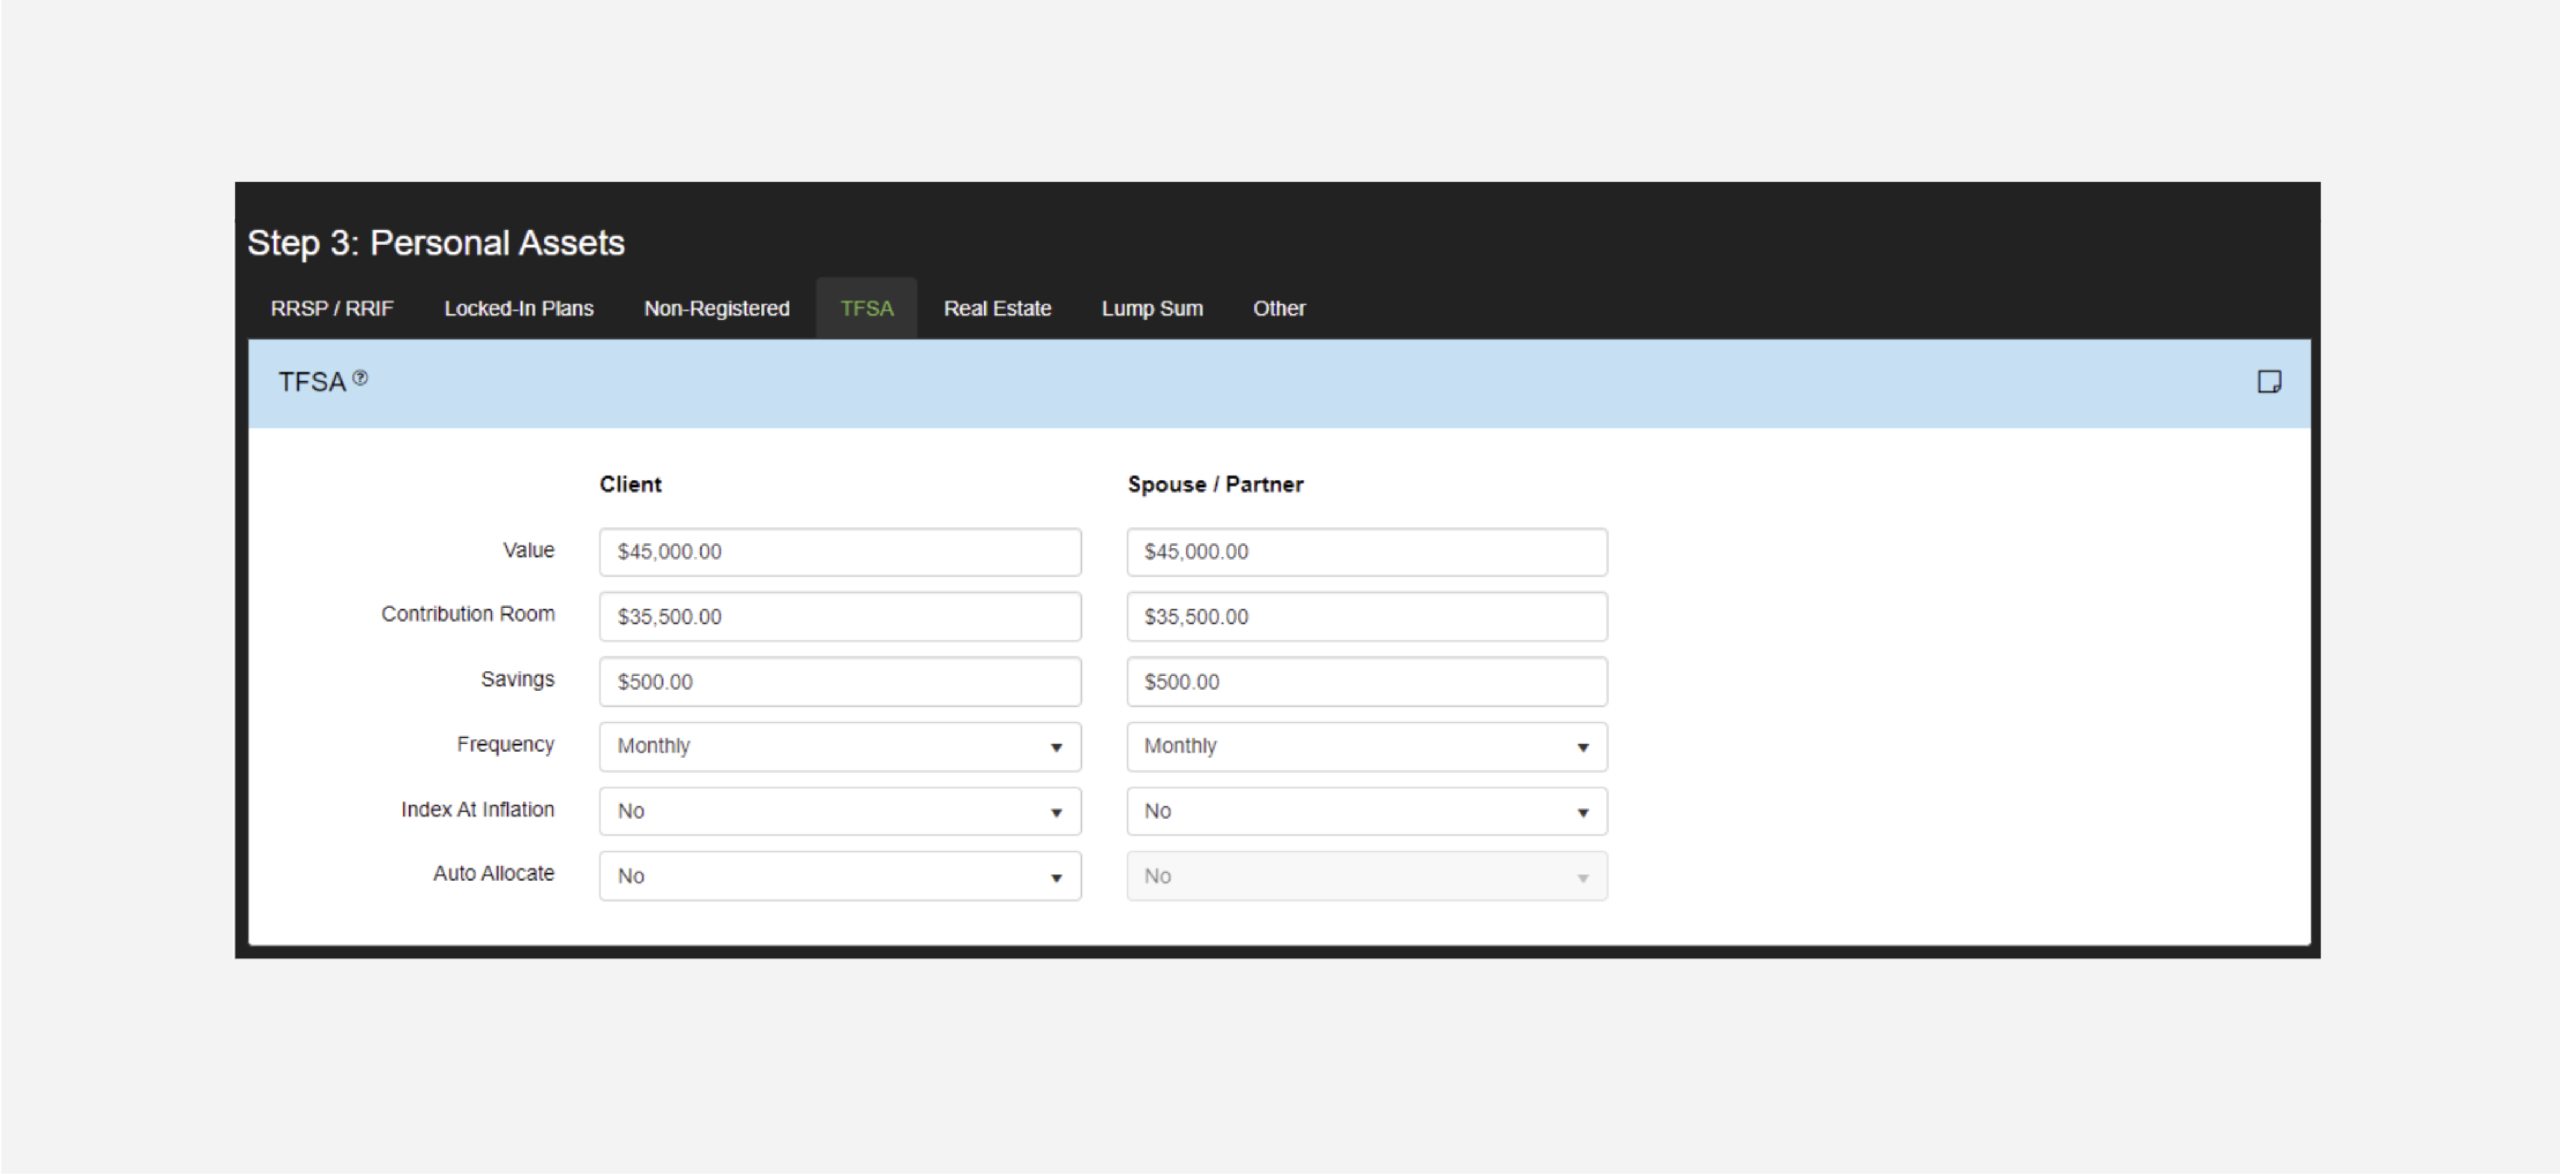
We can recommend to Peter and Stacy that they both increase their TFSA contributions to the annual maximum of $6,000/year because they have the extra cash flow in their pre-retirement years. If they both increase their monthly TFSA savings from $200/month to $500/month they will be able to meet their new retirement spending goal. The retirement options chart after this increase in savings, indicates that they could both retire when Peter turns 65 (Stacy is 63) and spend more on travel for the first 10 years.
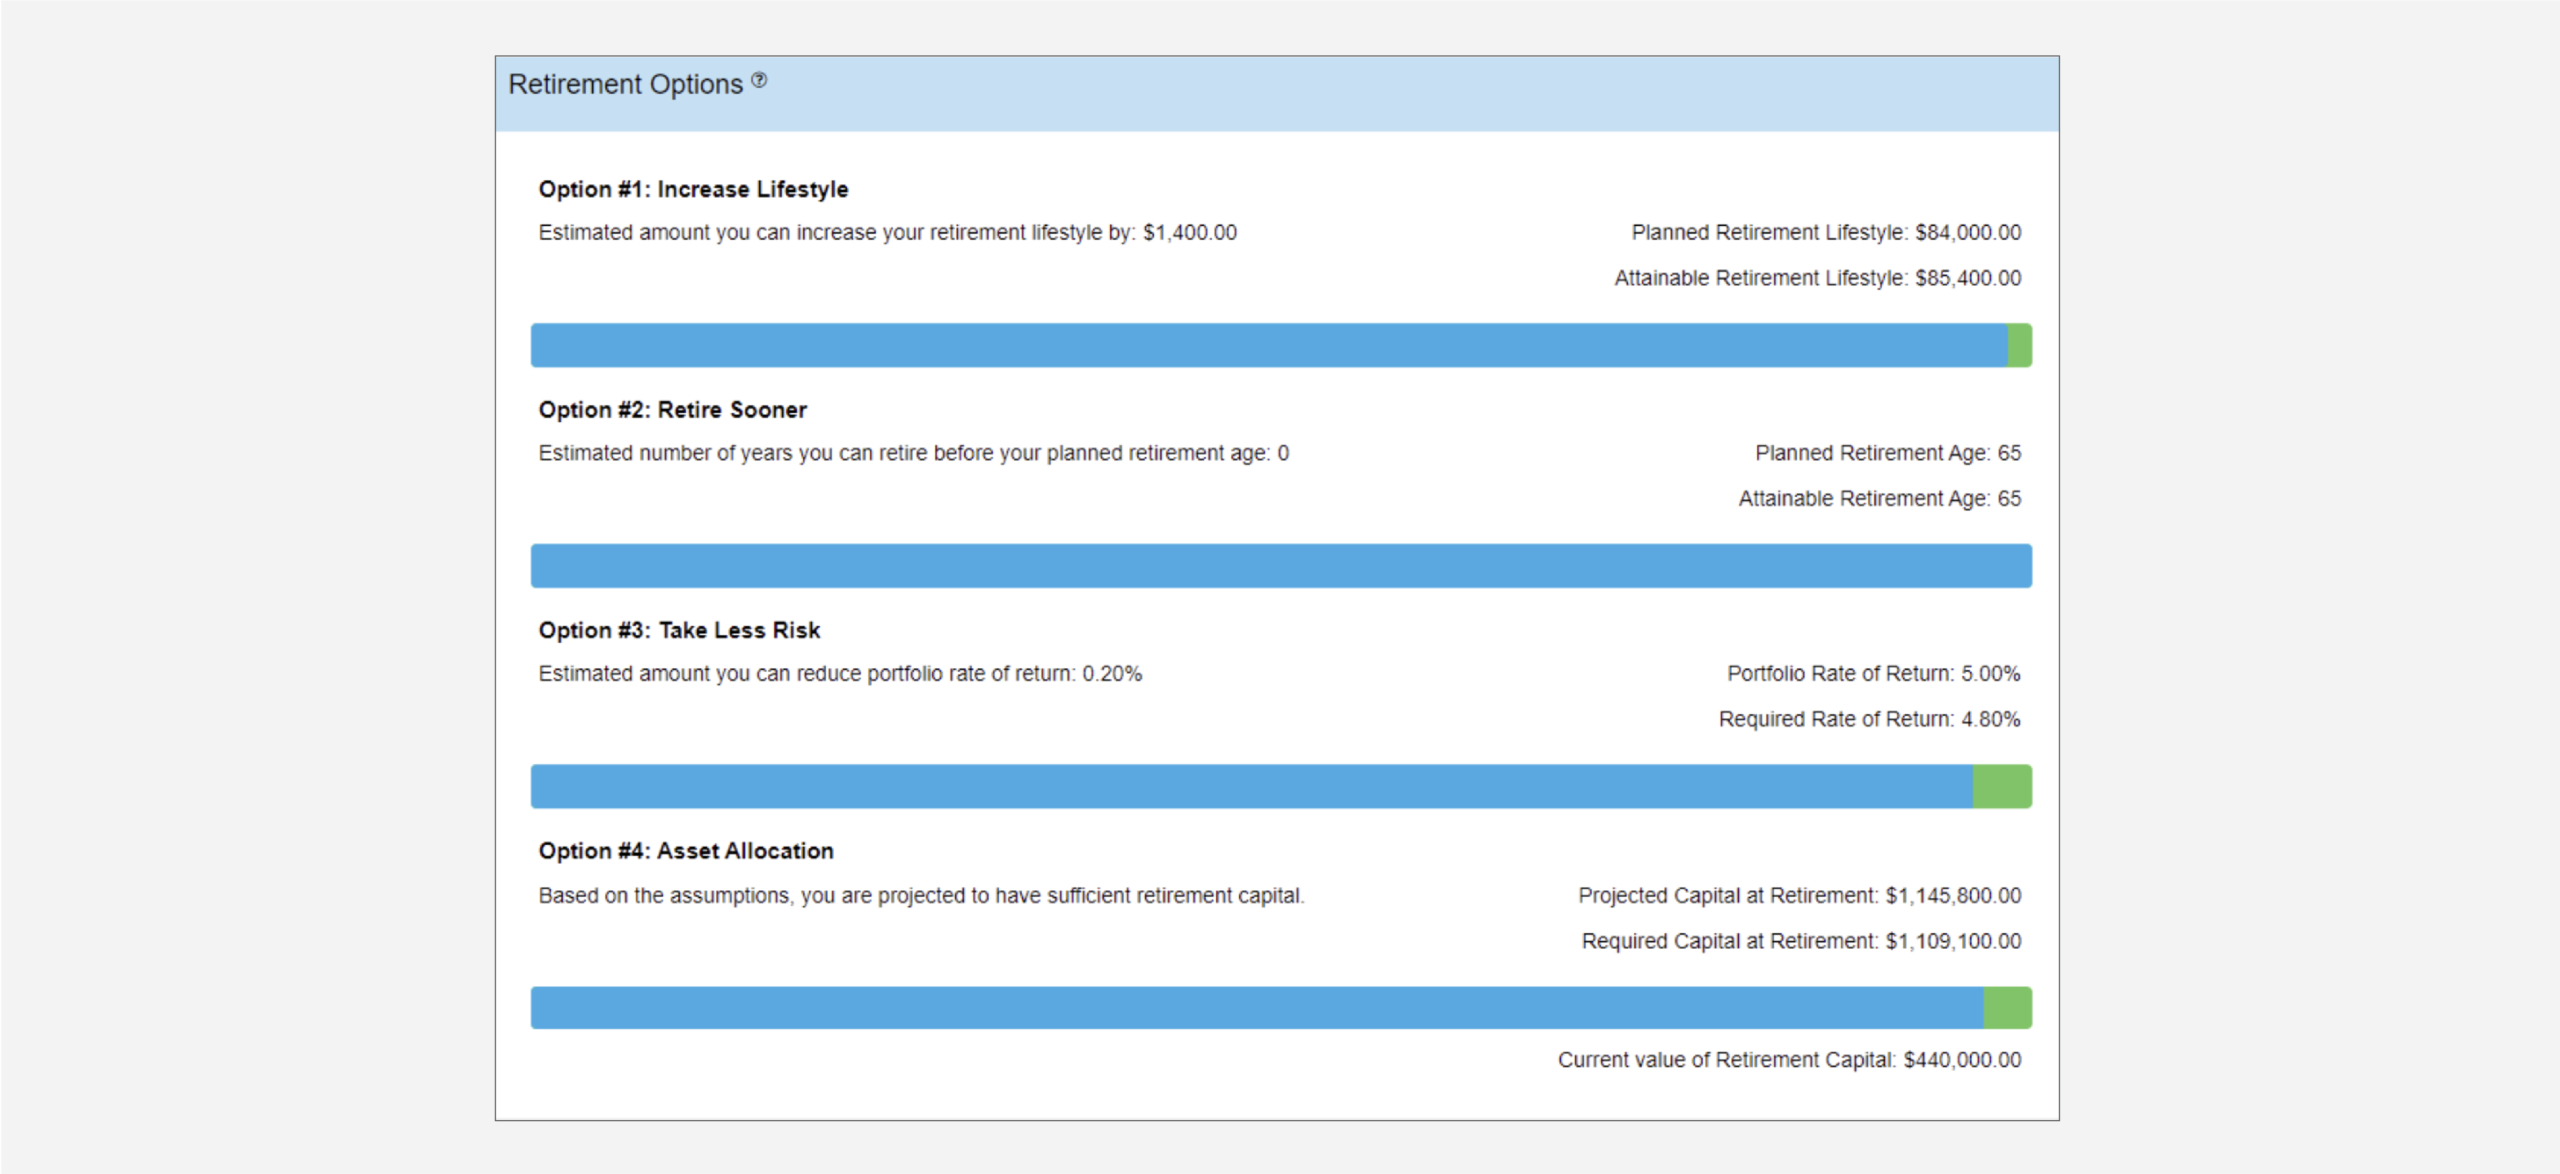
Using the retirement options area of RazorPlan allows you to see the impact of changing their retirement lifestyle and saving more to their TFSAs.
How To Build with RazorPlan:
This case requires the following account level assumptions set on the Settings tab in Your Account. Results will vary if these assumptions are not set up in your account.
Select Razor Academy from the RazorPlan home screen. From there select “Retirement Options” and click Download. The sample case will download to your RazorPlan account and automatically open.
The data downloads and displays in the program. Click through each step to see how the data provided by Peter and Stacy is entered into RazorPlan. At the final step click the Calculate button to calculate the results and build the charts. The information provided above in the current situation section will be displayed on the Retirement Options chart.
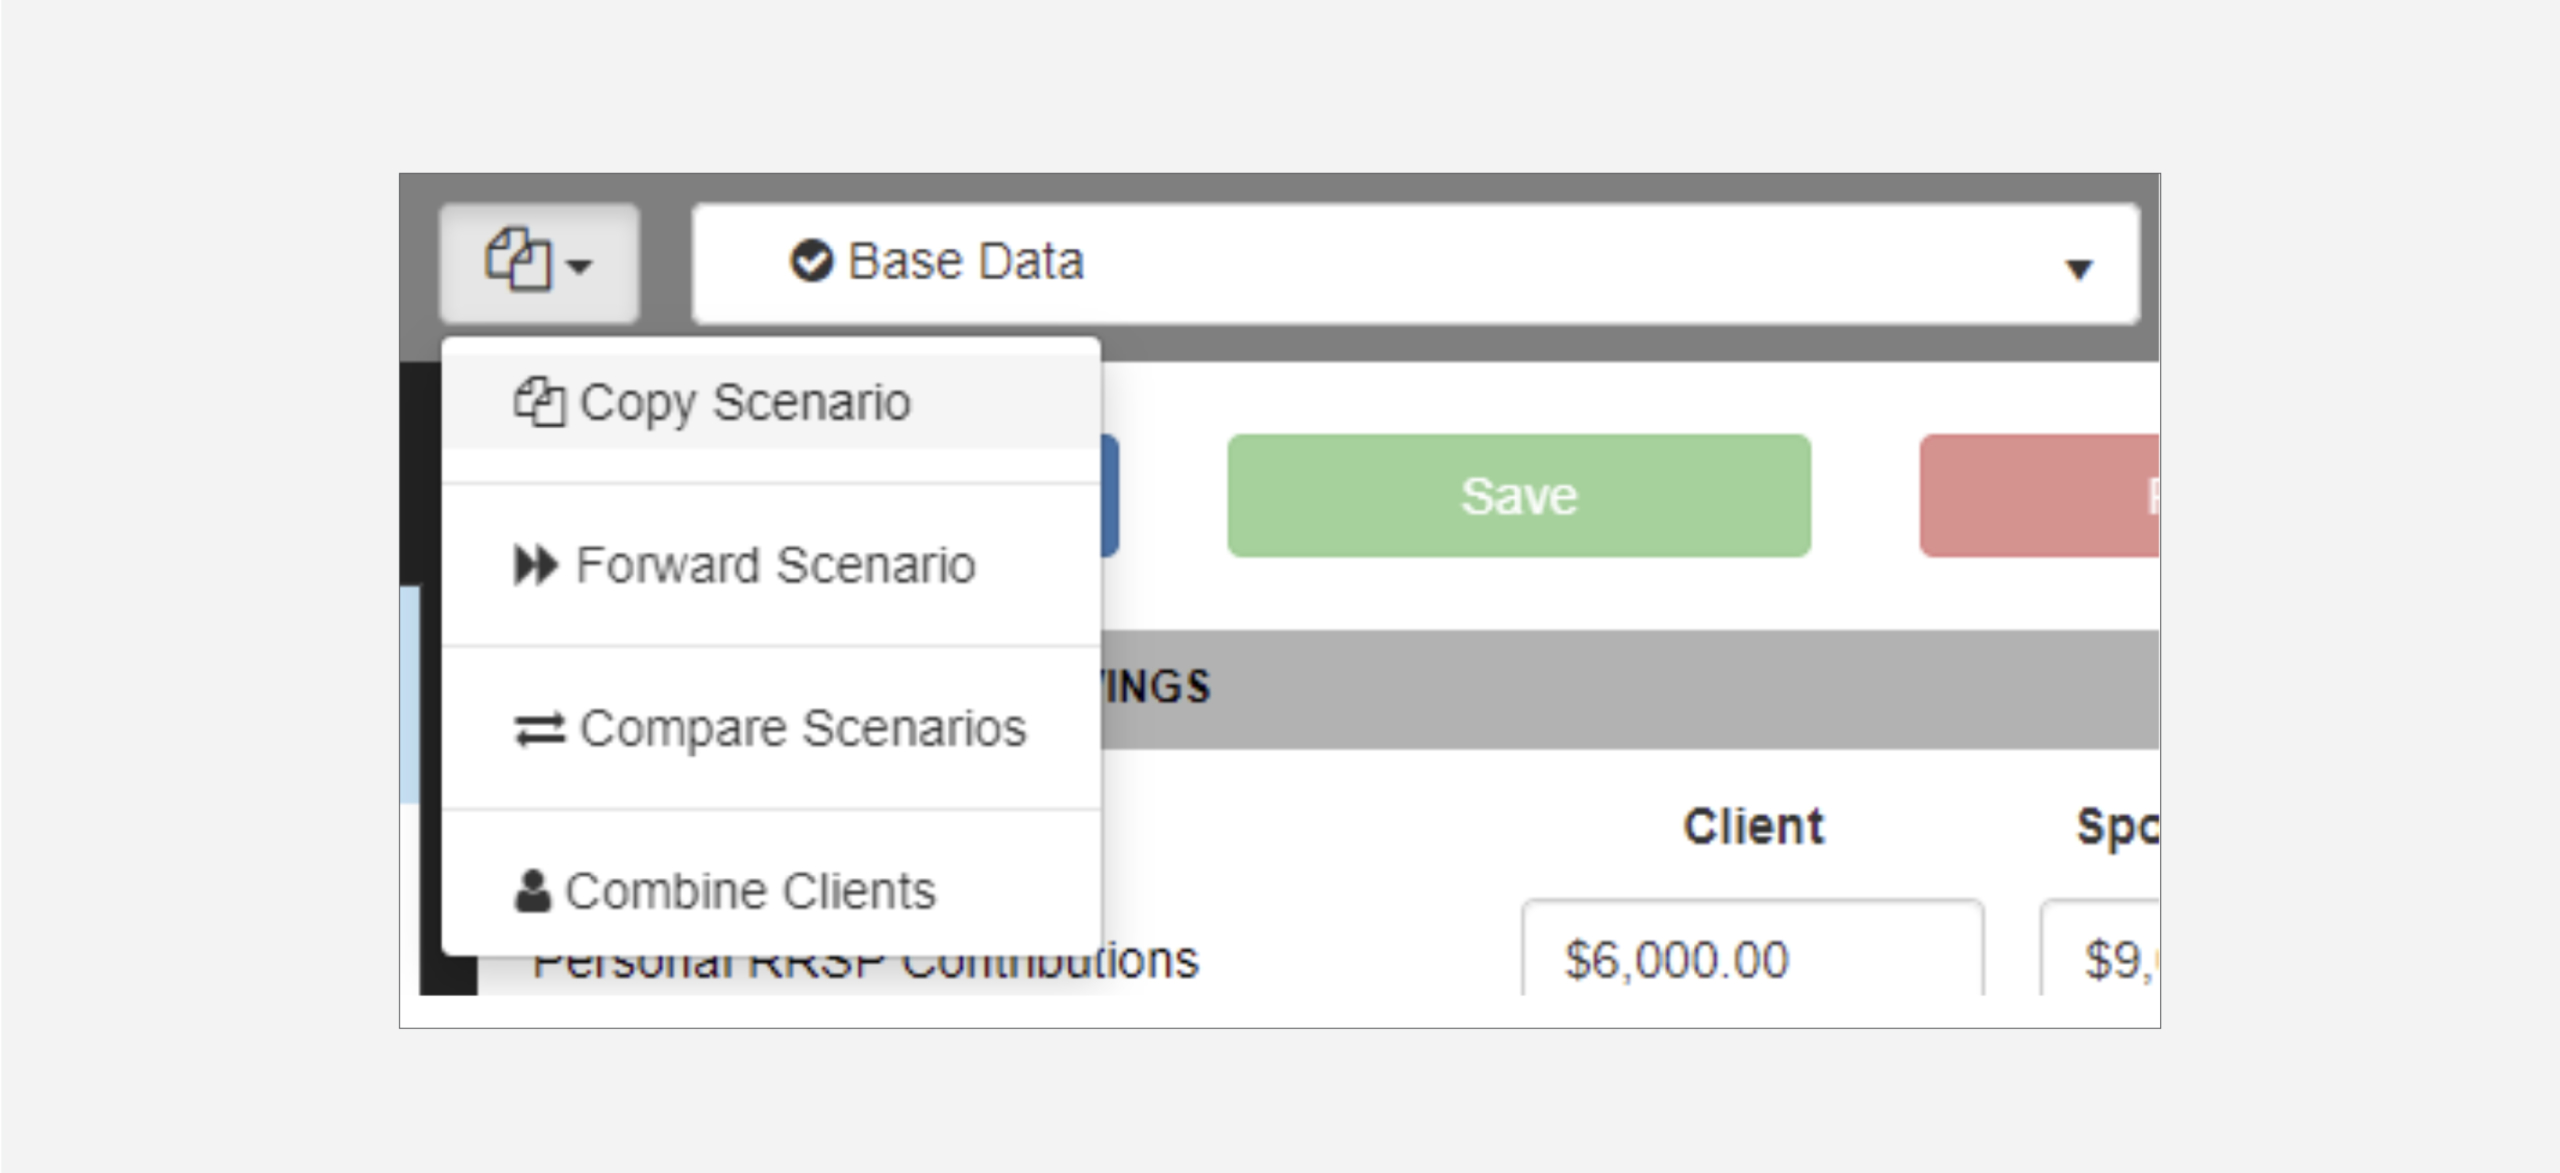
Click the Scenarios drop-down menu and select the Copy Scenario option.
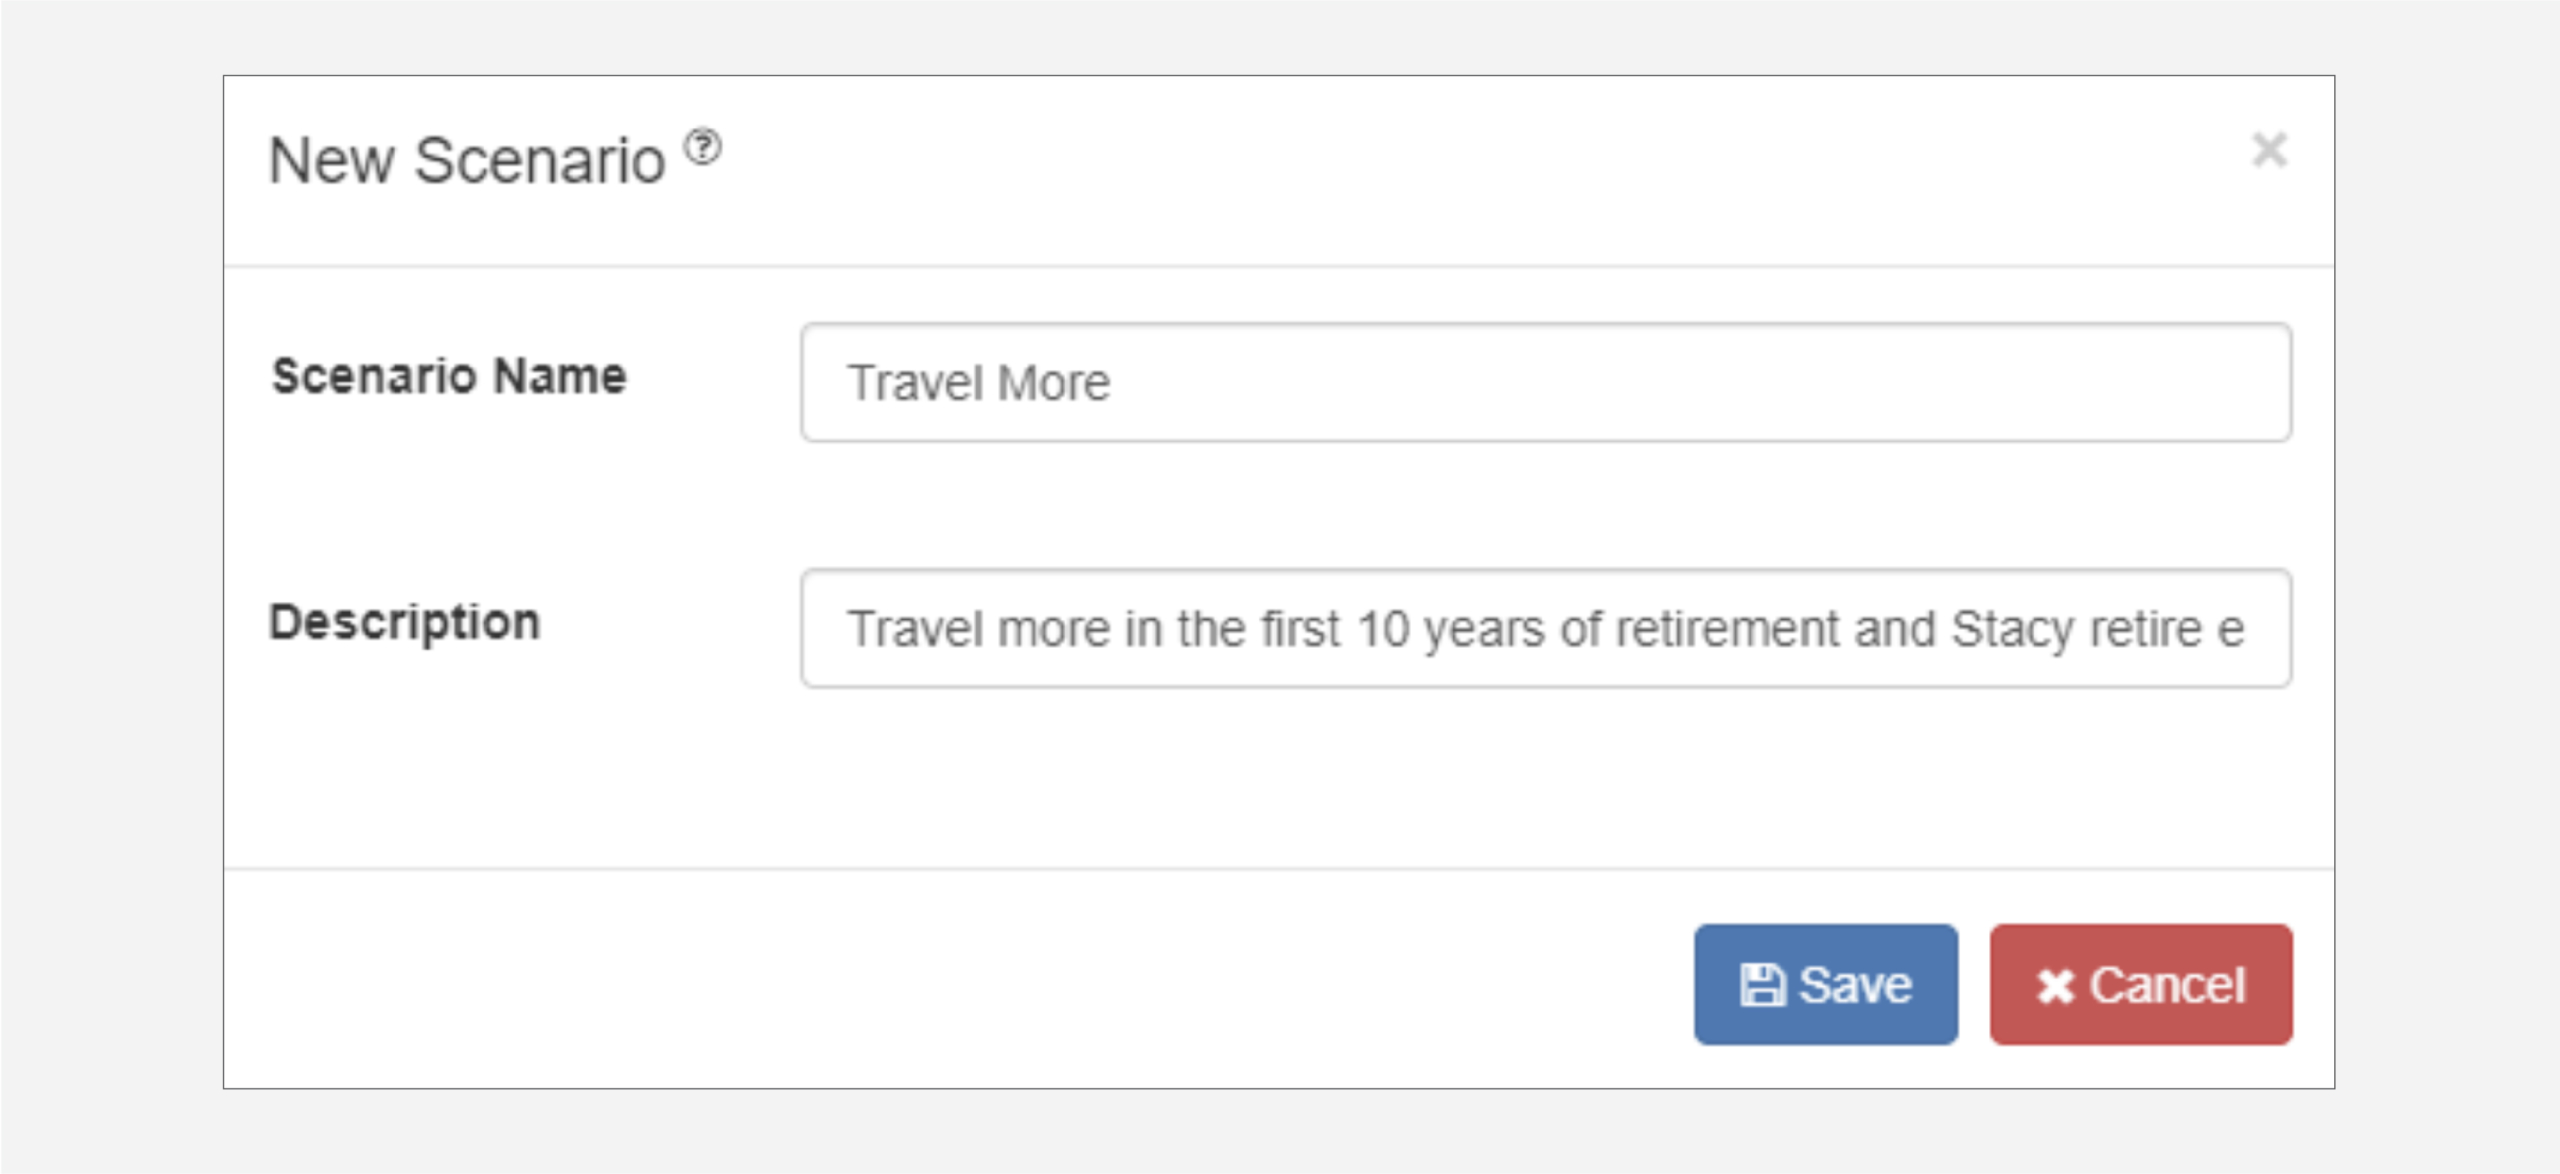
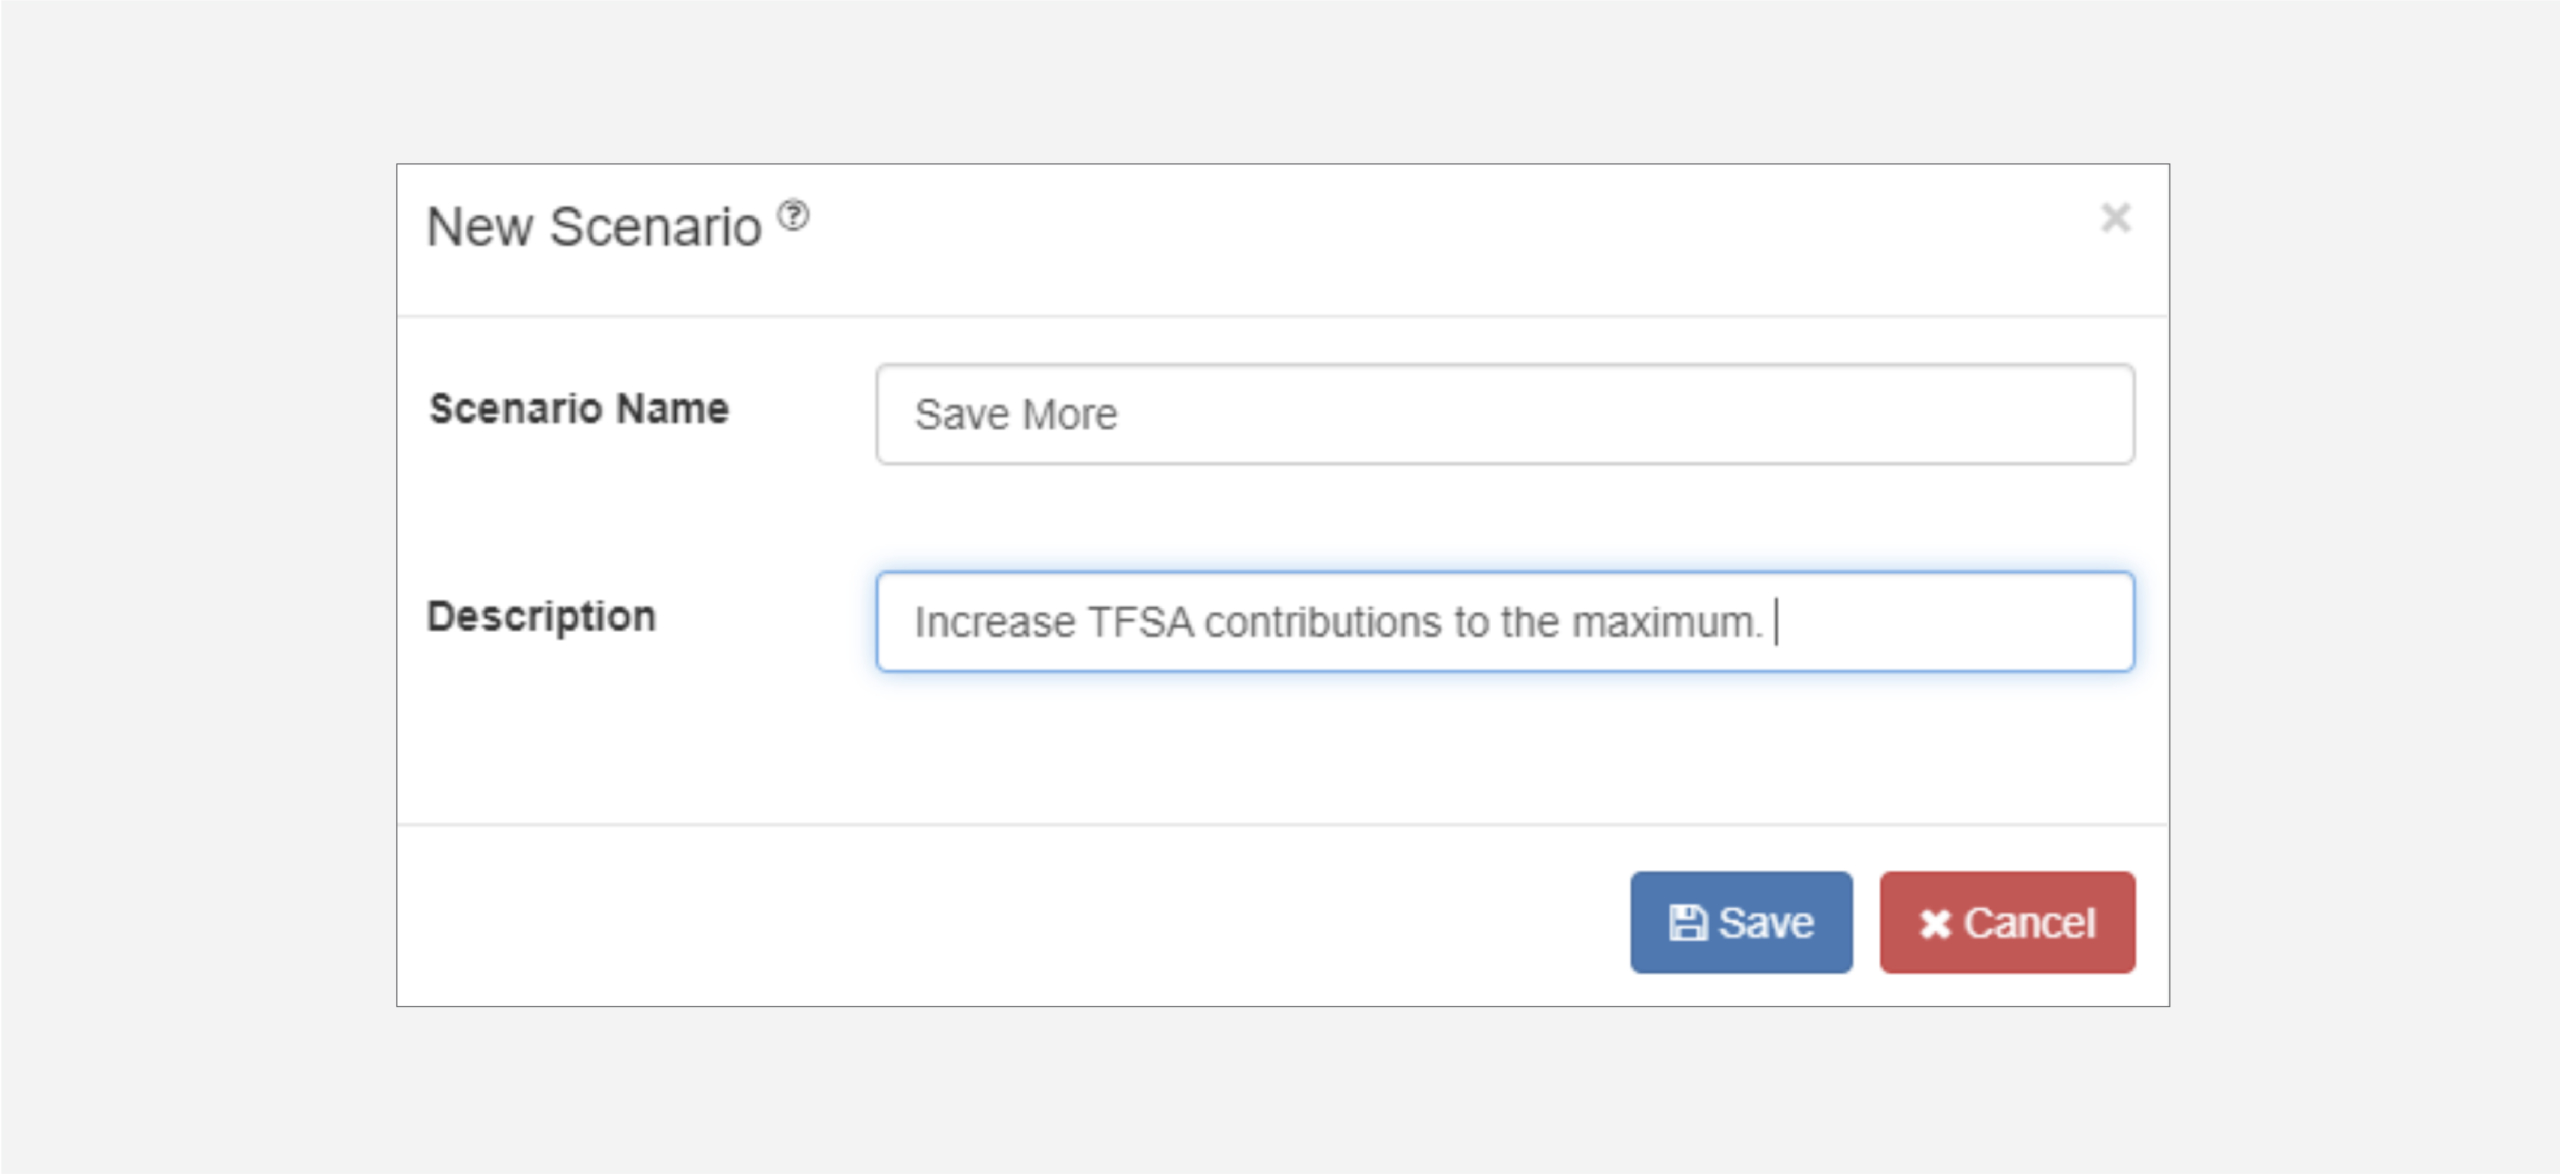
Give the new scenario the title of “Travel More” and add a description.
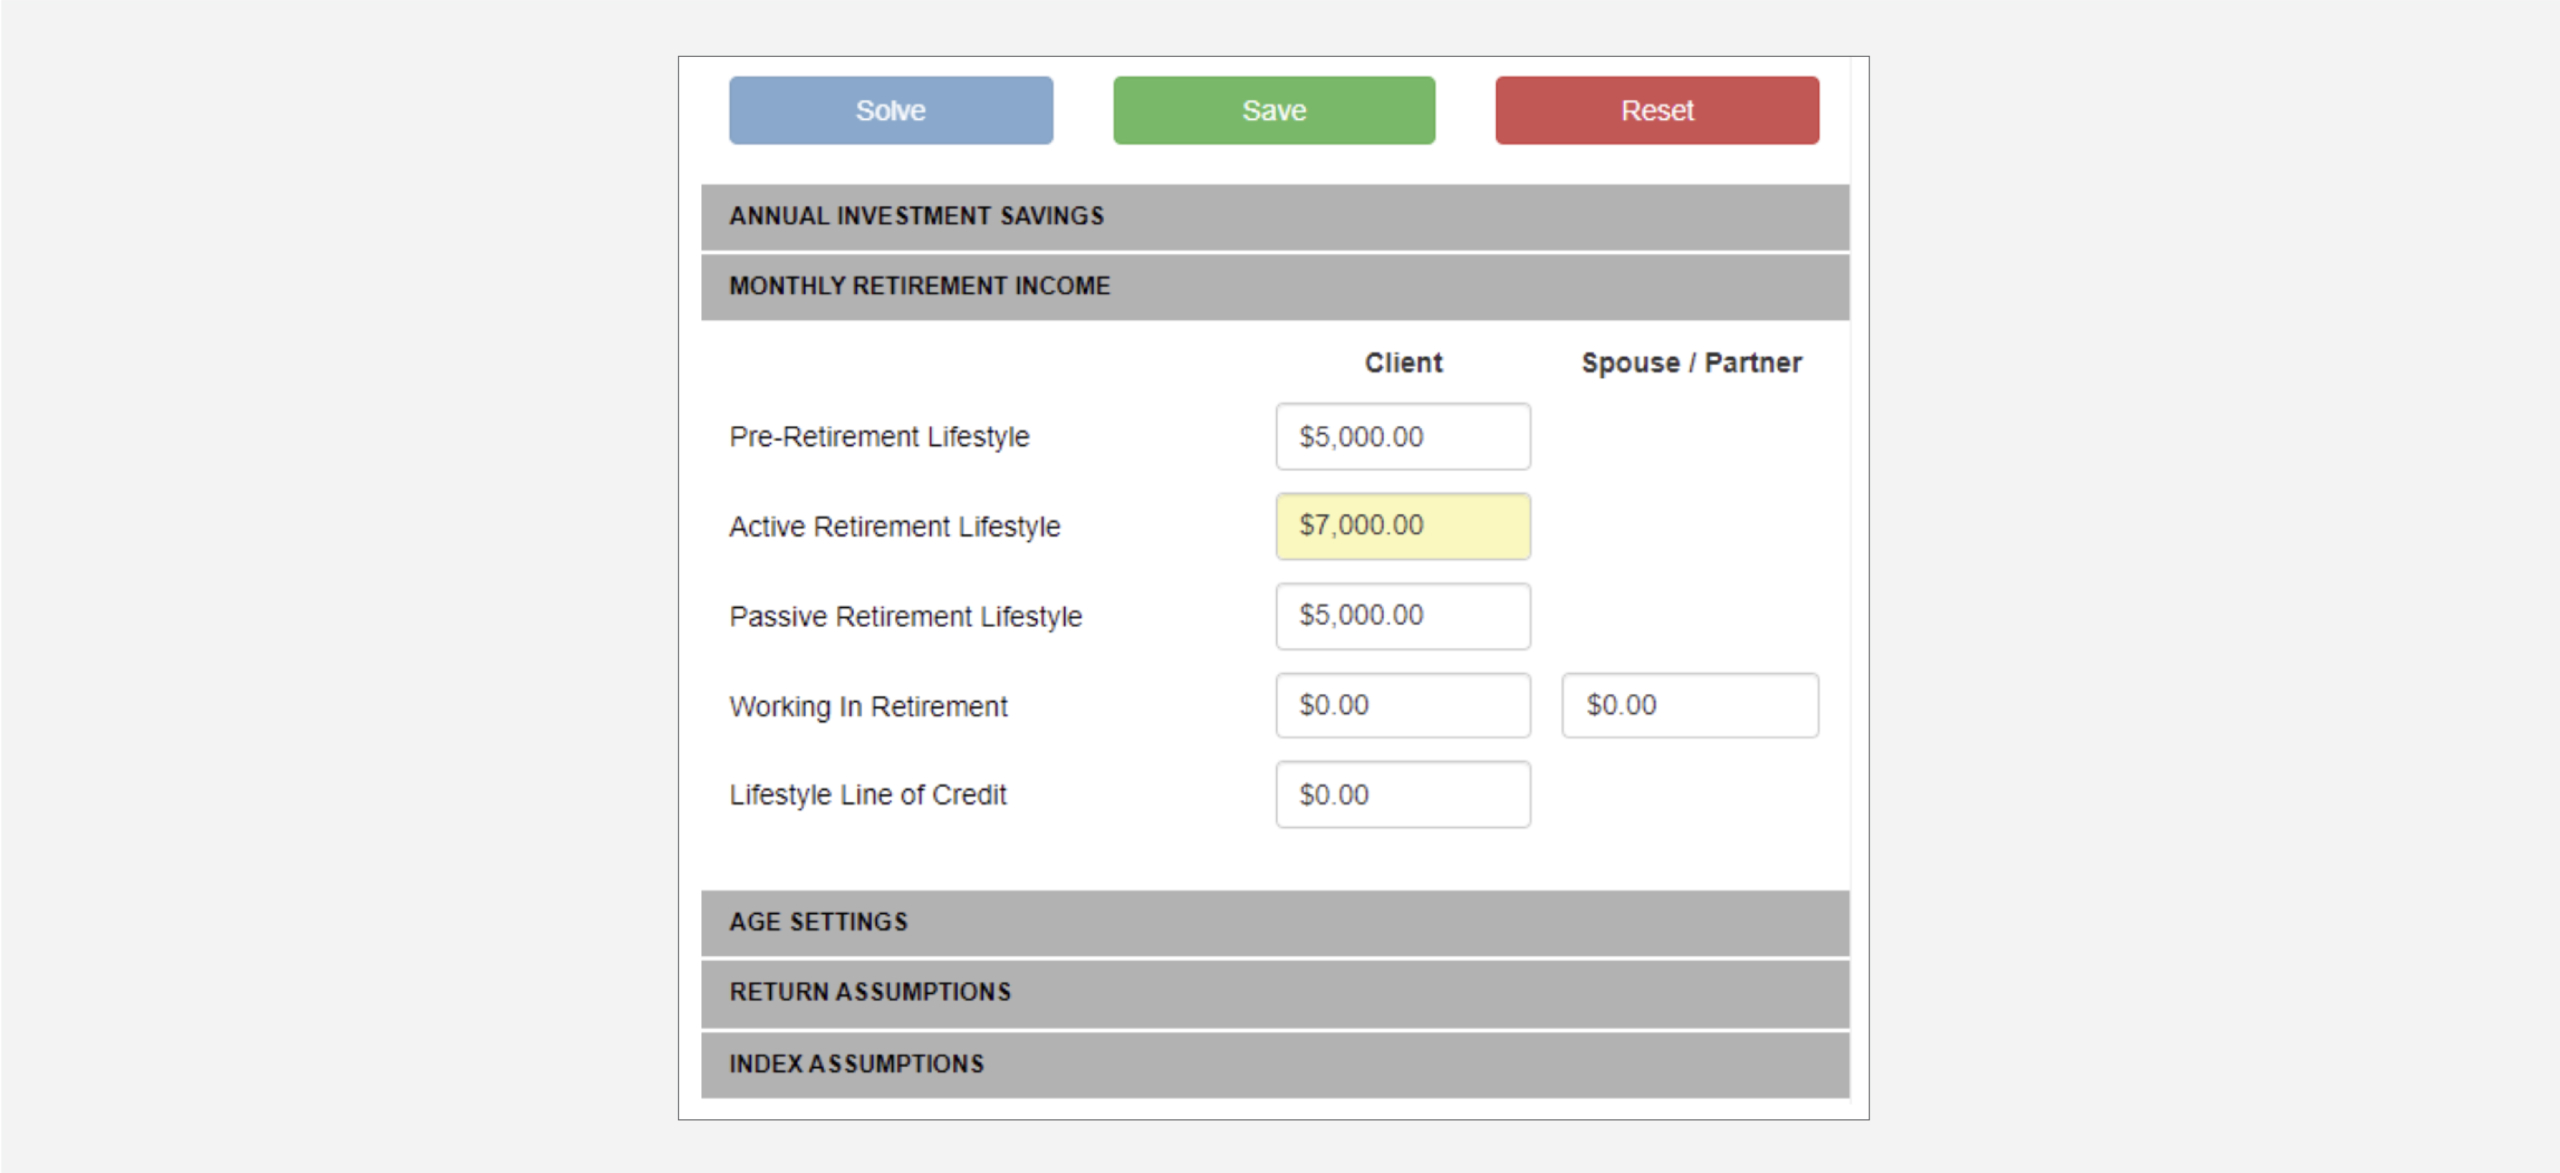
Using the What If panel on the right hand side of the charts screen change the following areas:
In the Monthly Retirement Income section, change Active Retirement Lifestyle to $7,000
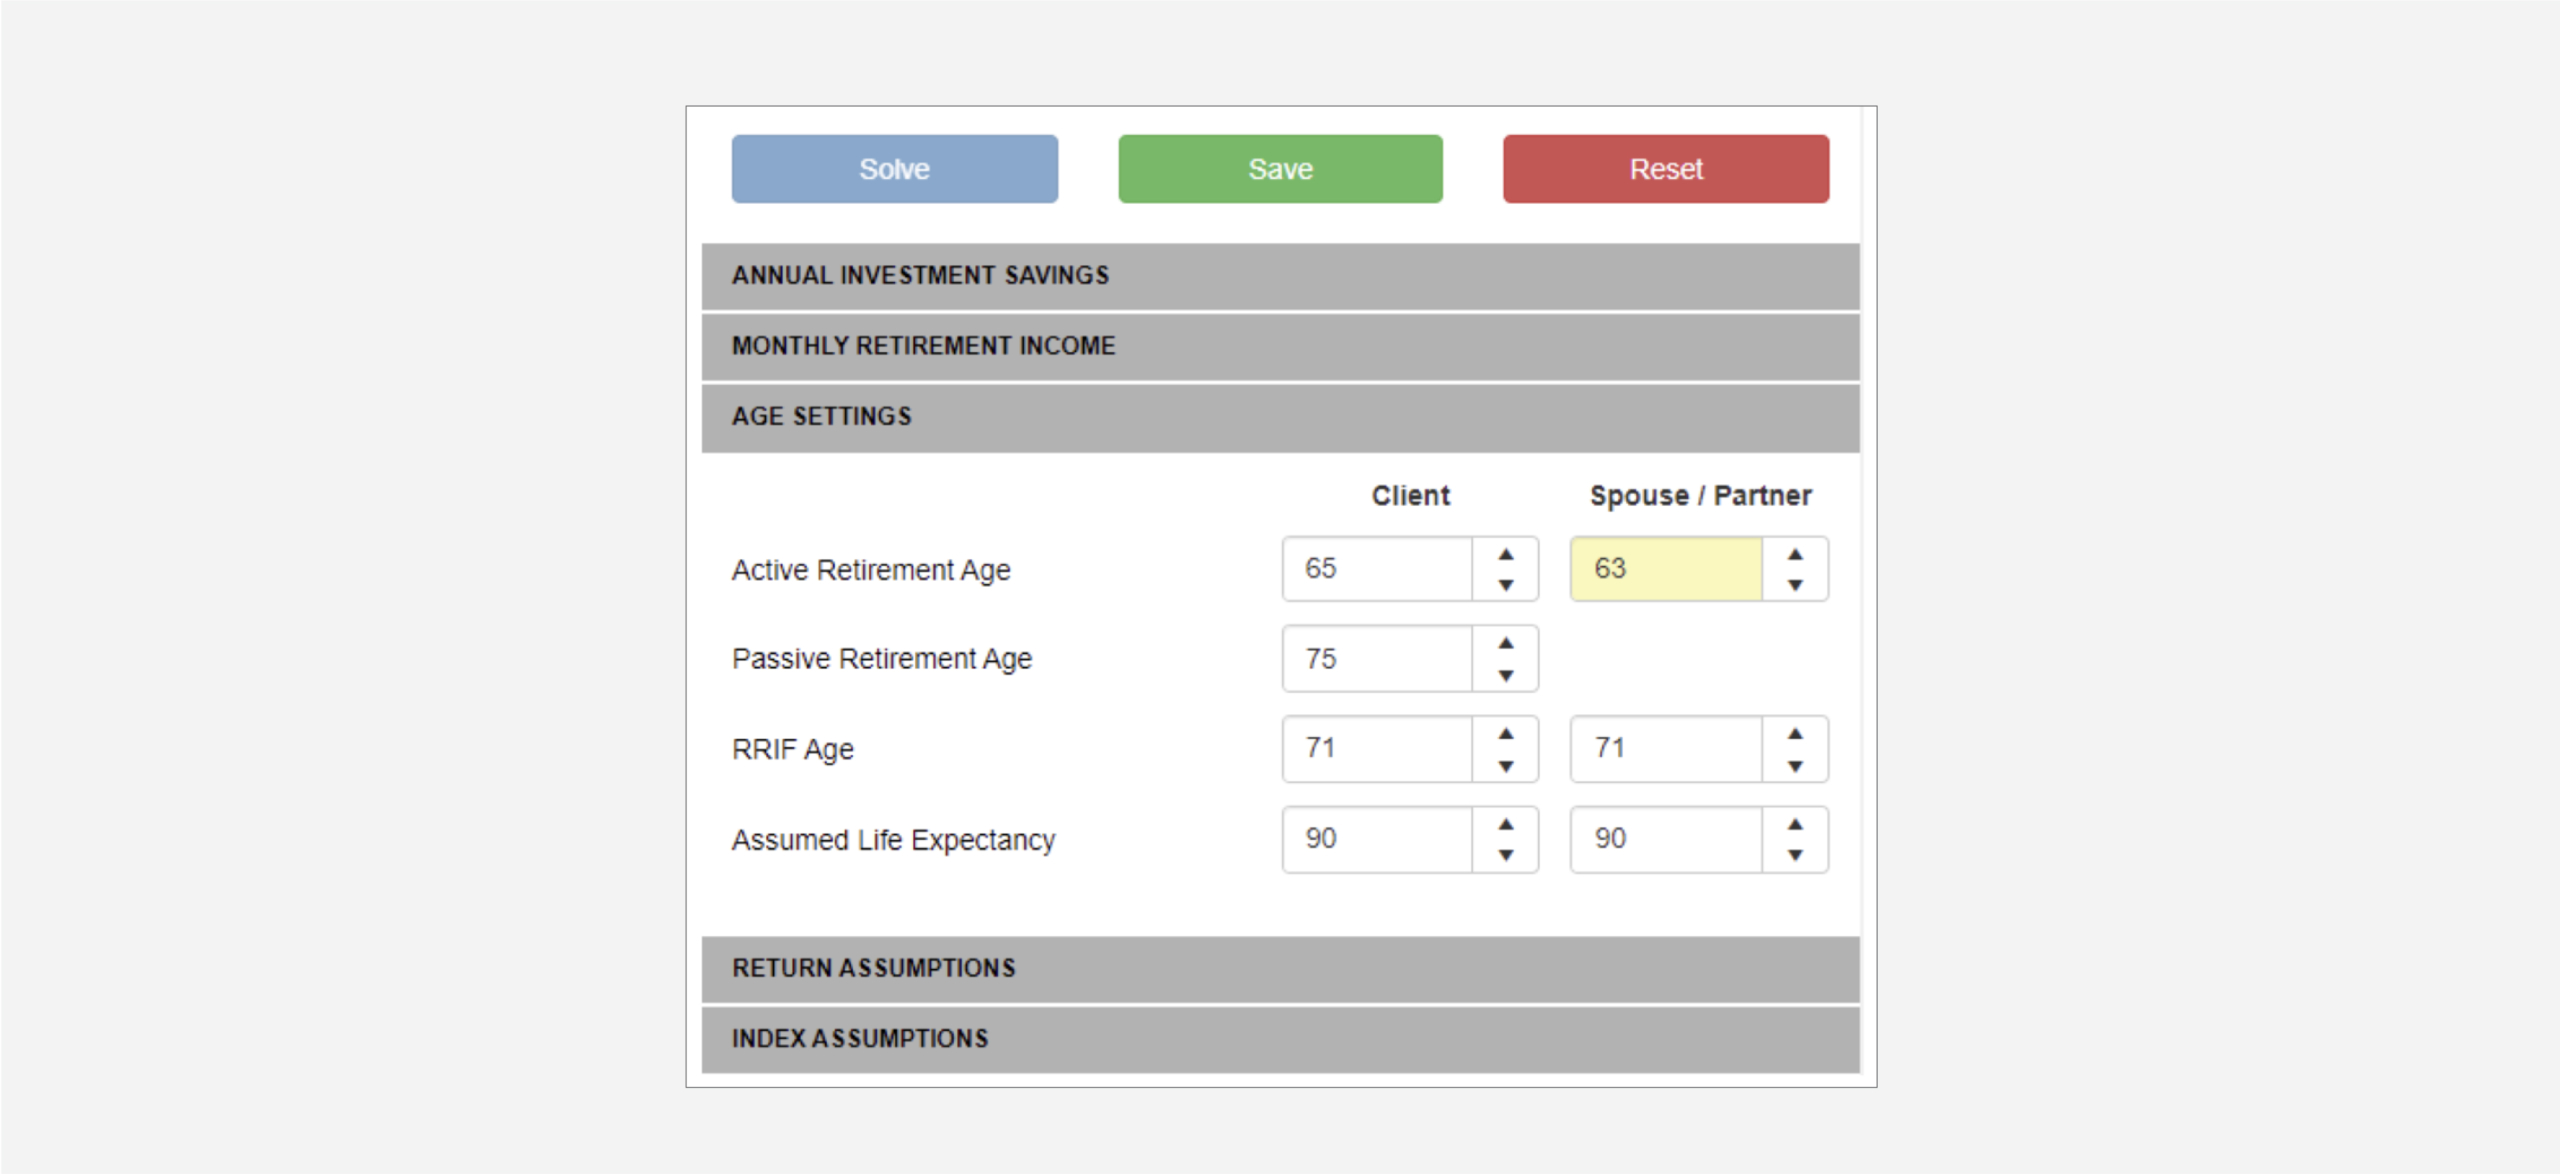
and In the Age Settings area change the Spouse / Partner retirement age to 63
Then click the ![]() button in the What-If panel.
button in the What-If panel.
Click the Charts button to review how these changes impact Peter and Stacy’s retirement. Both Cash Flow and Retirement Options will show that they are now short of meeting these new goals, as outlined in the What-If Situation above.
Click the Scenarios drop-down menu and select the Copy Scenario option.
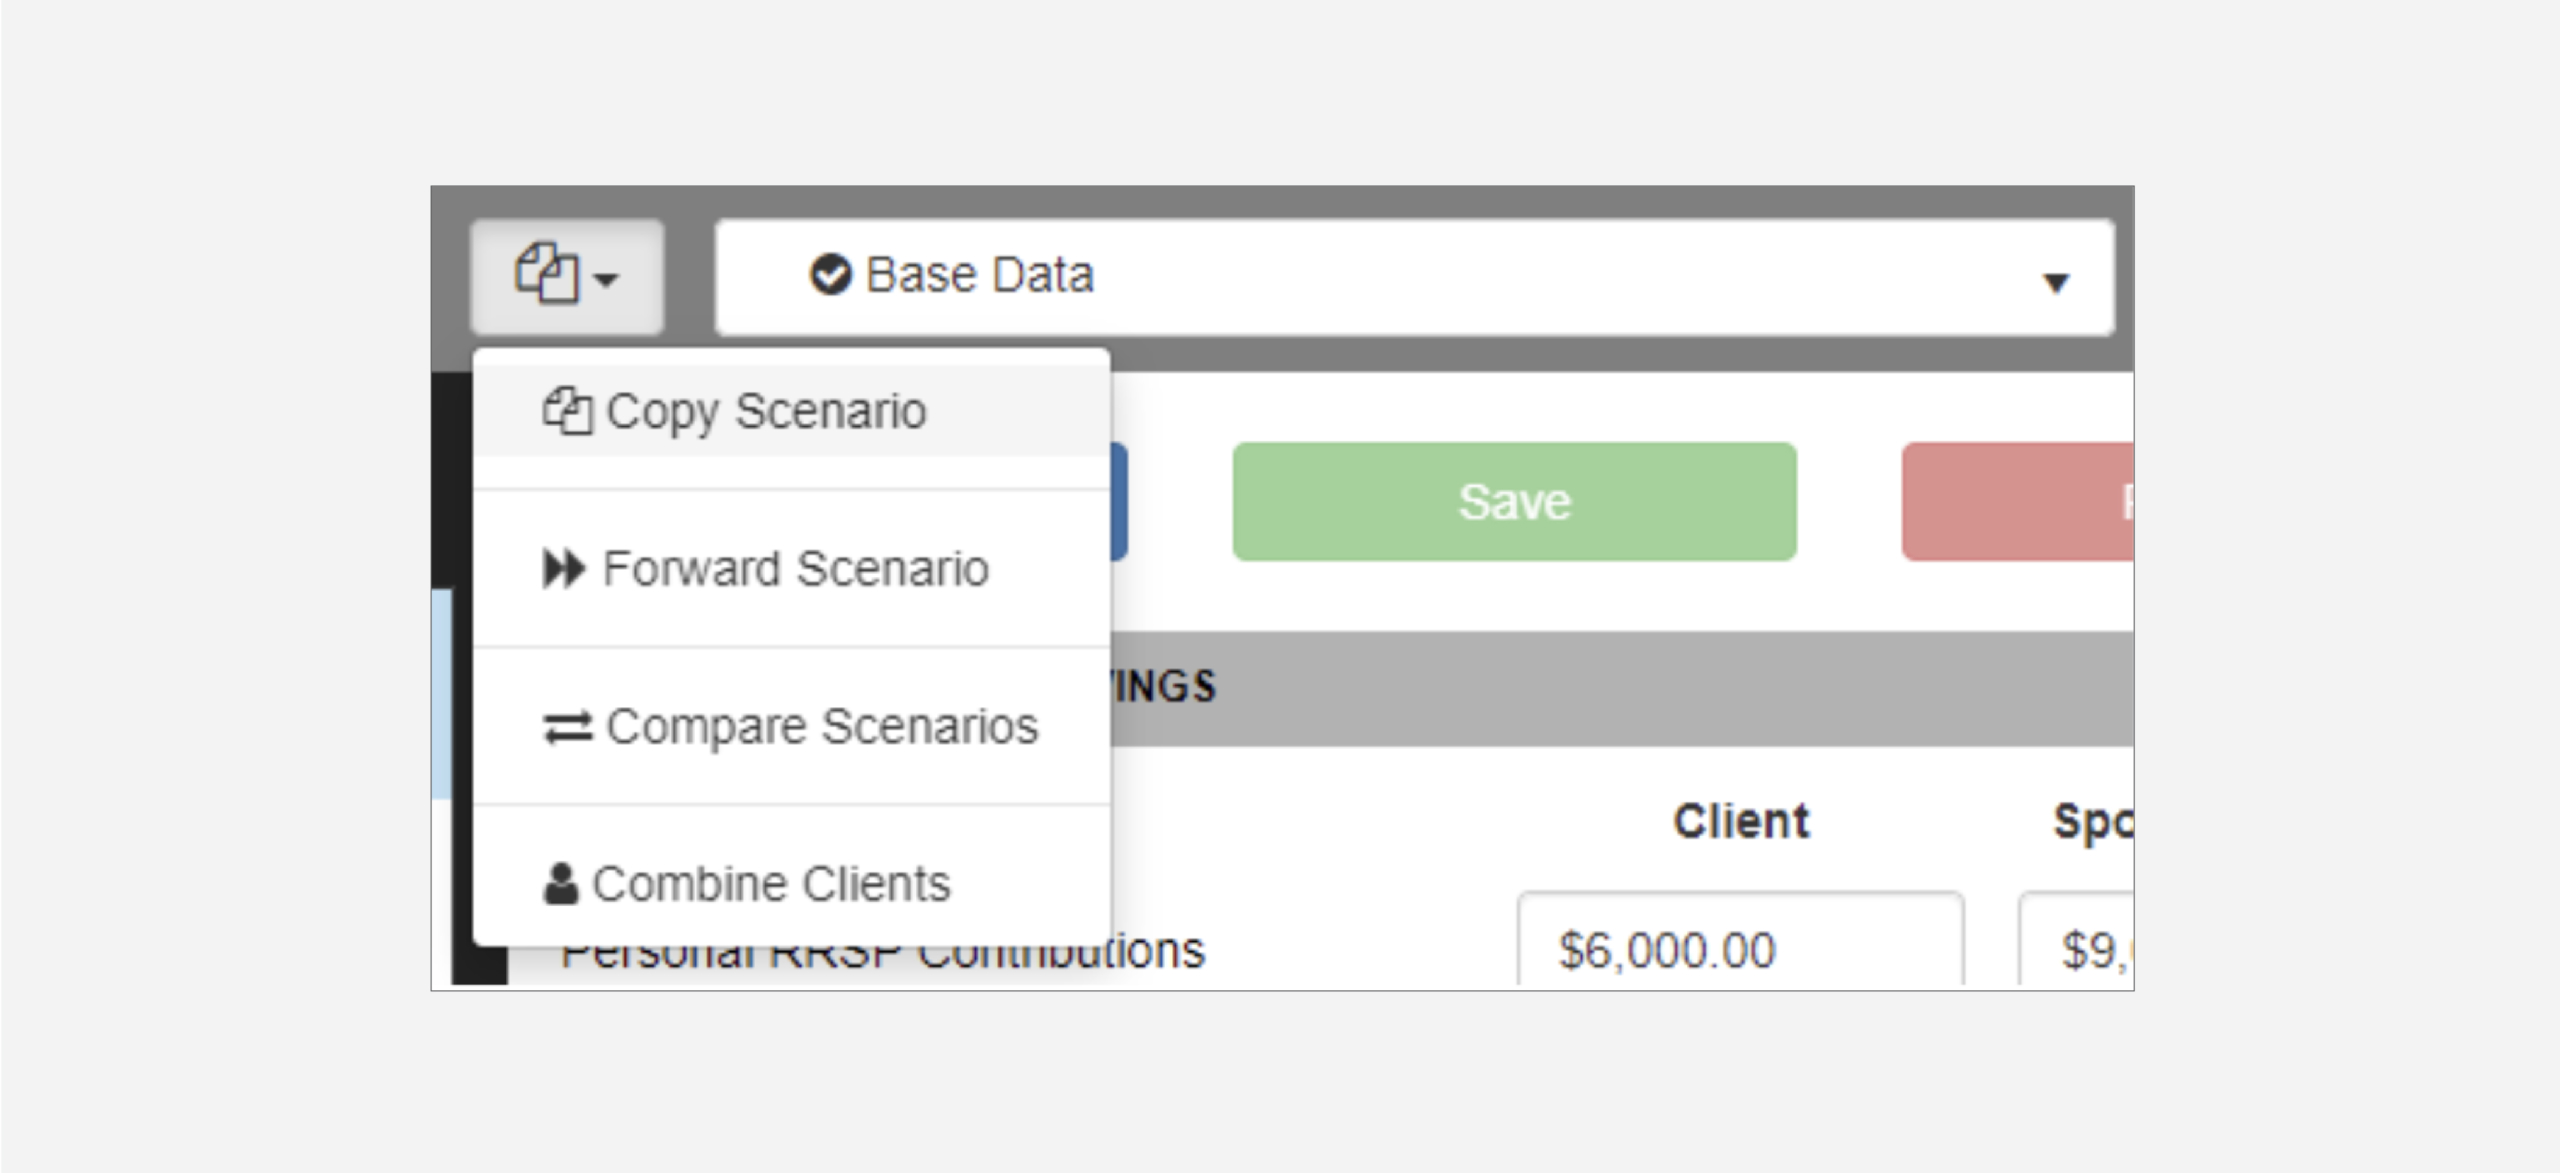
Give the new scenario the title of “Save More” and add a description.
Click the Data Entry button and go to Step 3 and then click the TFSA tab. Change the Savings from $200 to $500 for both clients.
Click the Charts button to review how the increased savings impacts Peter and Stacy’s new retirement goals. Review the Cash Flow and Retirement Options charts as outlined above in the What-If Situation section.
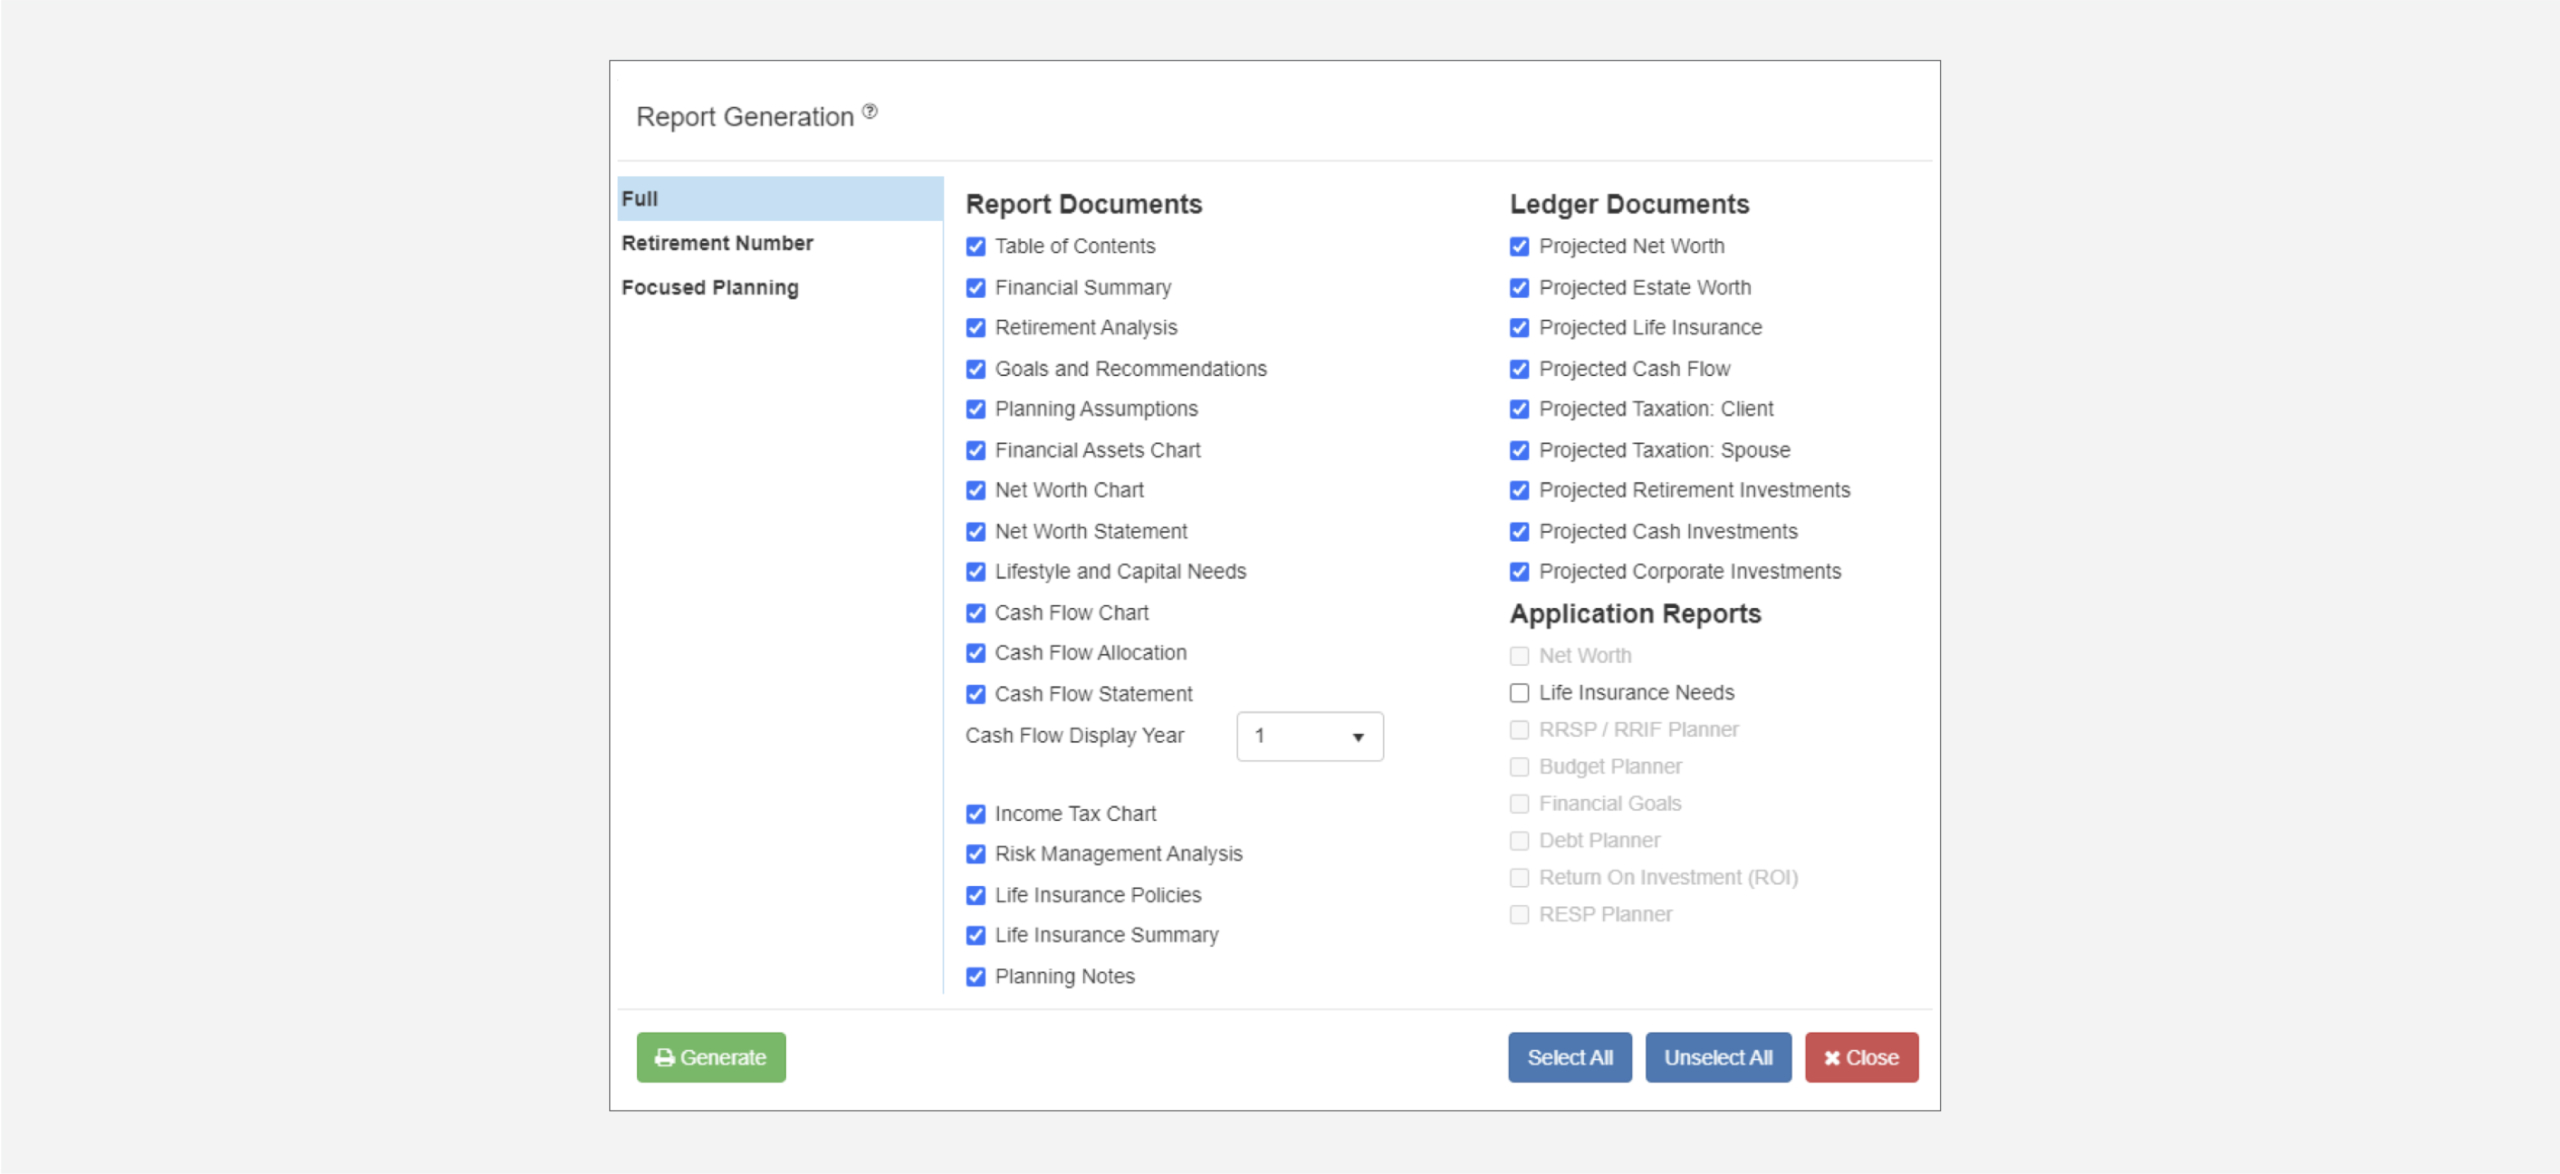
To produce a set of documents showing the plan to Peter and Stacy click on the Print icon found on the RazorPlan toolbar. Then select the pages you want to include in the print package, be sure to include the Retirement Analysis page to show the client their retirement options.
Using the Retirement Options area makes it easy to answer Peter and Stacy’s retirement questions. The scenarios feature also helps test the what-if situations they want to know more about and allows you show to a solution that increases their monthly saving rate.