Understanding Tax Efficiency
Razor Academy
To understand how Tax Efficiency can be used with Rate of Return to demonstrate the impact asset allocation can have on a client’s financial projection.
N/A
N/A
Disclaimer: The results and recommendations outlined in this example are for illustrative purposes only. The recommendations made are designed to demonstrate functions within RazorPlan and are not intended to act as a guide or real client recommendation.
Note: Due to potential changes in the software or updates to math and taxation, your results may not exactly match the following outline.
Asset allocation is important in every financial analysis because it establishes both the growth on investments as well as the portion of that growth that is subject to tax.
However, there are many challenges associated with modeling an asset allocation within a financial analysis.
RazorPlan uses a concept known as Tax Efficiency to simplify this process. By focusing on Tax Efficiency and Rate of Return, RazorPlan can accurately calculate the impact of any asset allocation model on a client’s financial projection.
The level of tax within a portfolio will be a key factor in its performance. Tax Efficiency is the portion of income generated from an investment that is not subject to taxation.
For investments that are not in programs such as RRSPs and TFSAs, asset allocation not only generates a rate of return, it also has a direct impact on the taxation of the portfolio. Each asset class can generate income though interest, dividends, or capital gains and will provide a different level of taxable income.
When combining all the income generated from a portfolio we can calculate the overall rate of return. Then by analyzing how much of that income will be subject to tax we can also determine the Tax Efficiency of that portfolio.
As you can see from the chart below, each type of investment income earned will produce a different Tax Efficiency based on the portion of income that would not be taxable. For example, interest income is fully taxable and therefore produces a 0% Tax Efficiency.

Interest income is fully taxable in the year it is earned which results in a 0% Tax Efficiency. Dividends and Capital Gains receive preferential tax treatment and will produce higher levels of Tax Efficiency.
Assuming Cash earns 2%, Fixed Income earns 4%, and Equity earns 7%, each of the following five asset allocations will result in the same portfolio return but produce different levels of after-tax income.
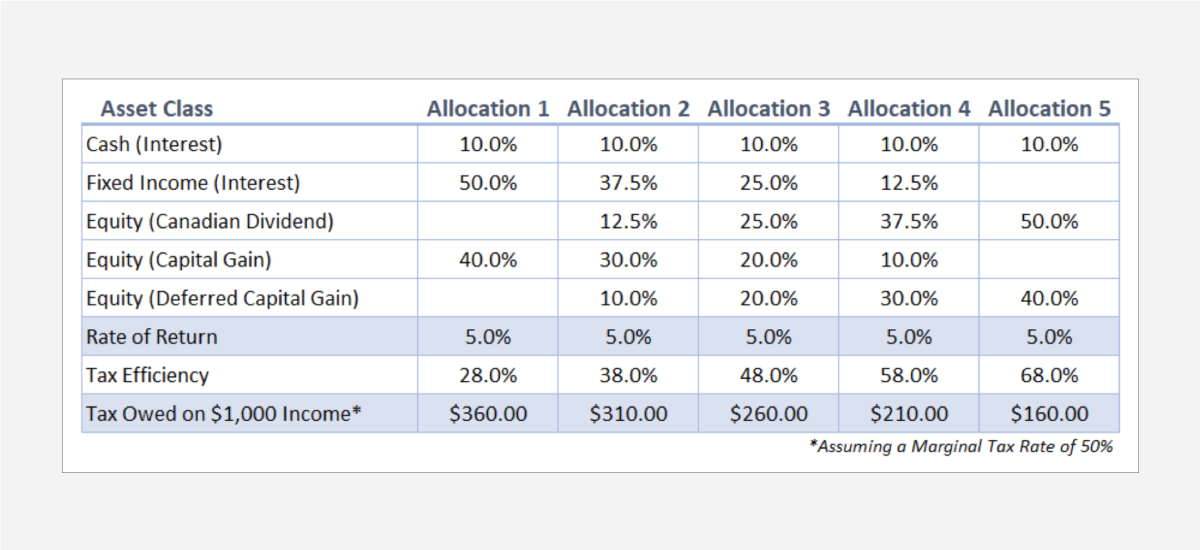
Assuming a 50% marginal tax rate, the table above shows the impact Tax Efficiency has on $1,000 of investment income. Allocation 1 and Allocation 5 both produce a 5% return but Allocation 5 is 40% more tax efficient, resulting in $200 less taxes for every $1,000 of income. By simply using Rate of Return and Tax Efficiency, advisors can reconstruct any one of these portfolios within RazorPlan with minimal effort.
By incorporating tax efficiency into RazorPlan, advisors are able to minimize the complexity of a financial analysis but maintain accurate tax calculations. The end result is a more efficient process.
To help calculate the Tax Efficiency of a portfolio, download the Tax Efficiency Calculator.
How To Build with RazorPlan:
This case is assumed to have the following account level assumptions. To replicate this case as outlined below, be sure to update your Account Settings to match through Your Account. Additional steps may be required if you do not choose to set up your account this way.
Select Razor Academy from the RazorPlan home screen. From there select “Tax Efficiency” and click Download. The sample case will download to your RazorPlan account and automatically open.
In the Settings step of Data Entry, select the Risk/Return tab. From here you can select the Risk Profile, Rate of Return, and Tax Efficiency to apply to the various account types.
Because the income within Registered Investments is tax sheltered, Tax Efficiency will only apply to Non-Registered and Corporate Investments. In this example, we’re going to use Allocation 2 from the above chart and assume a 5% Rate of Return and a Tax Efficiency of 38%.
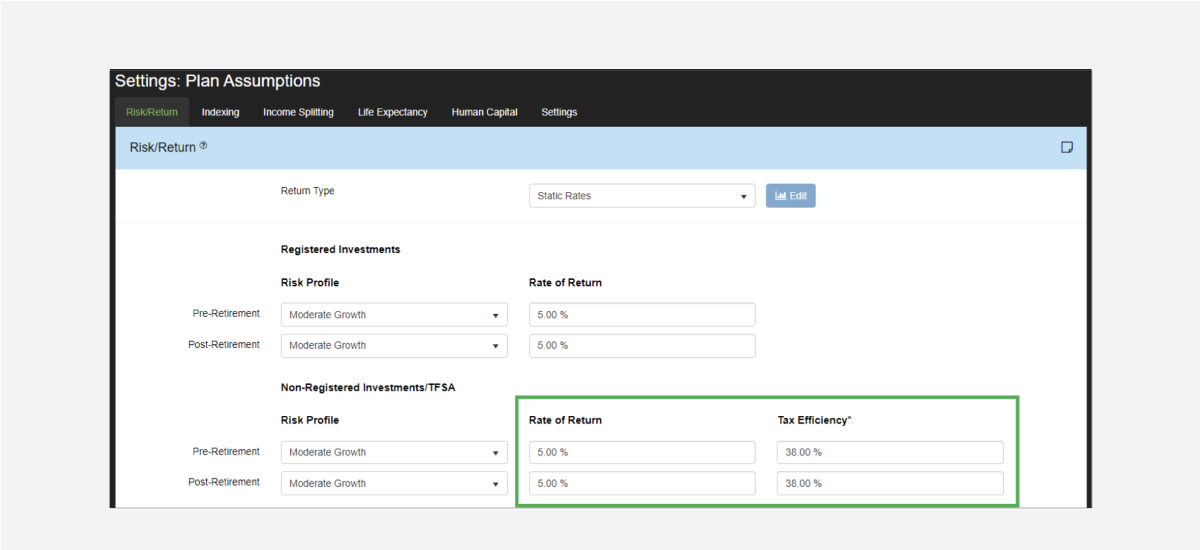
Based on our assumptions of a 5% Rate of Return and 38% Tax Efficiency, Option #1 demonstrates that the clients have an Attainable Retirement Lifestyle of $80,400.

By reallocating the clients’ Non-Registered portfolio to Allocation 5, we can achieve a higher Tax Efficiency even though we haven’t increased the overall Rate of Return. Navigate to the Settings area of Data Entry and increase Tax Efficiency to 68%.
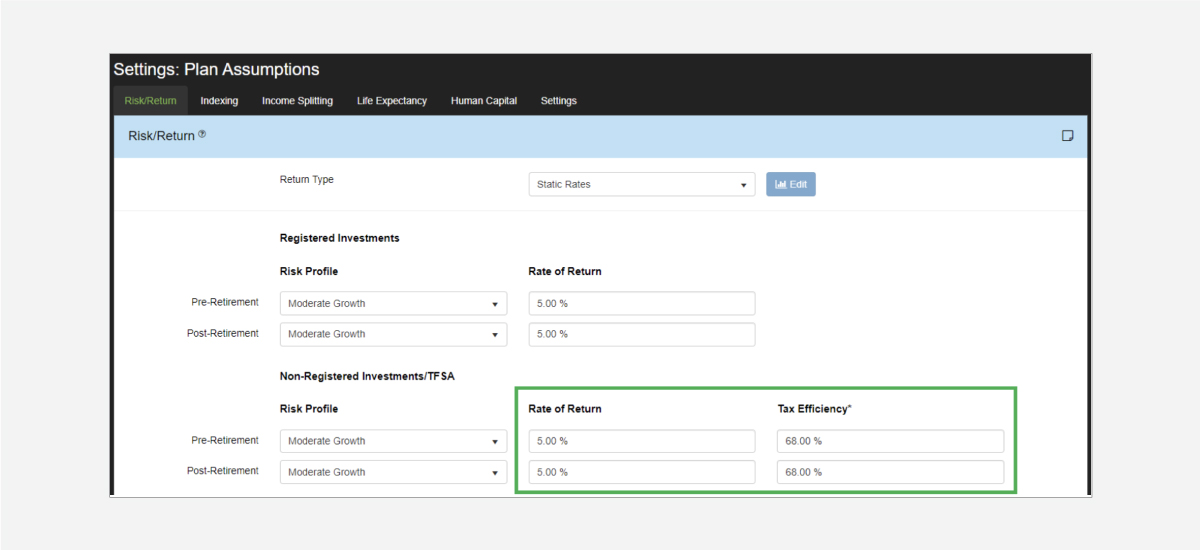
After modifying the clients’ Tax Efficiency to match Allocation 5, we can see that the clients’ Attainable Retirement Lifestyle has grown to $81,600, an increase of $1,200 per year for the life of the clients.

Using Rate of Return and Tax Efficiency will allow you to easily model any client portfolio and quickly make changes to examine different recommendations.